How much rain and snow fall on Earth in any given year? NASA scientists are answering this question more accurately than ever before and observing precipitation in the most remote places on Earth. And it’s all thanks to an international constellation of satellites.
 algorithm.")
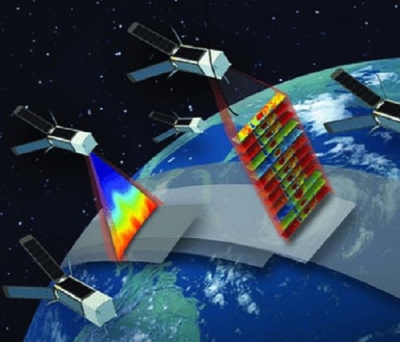
At any given time, instruments aboard about a dozen satellites contribute to a record of the world’s rain and snow. Together, these instruments make up the joint NASA/Japan Aerospace Exploration Agency (JAXA) Global Precipitation Measurement (GPM) mission. "Most of the satellites contributing to GPM aren’t precipitation satellites, per se," said George Huffman, who is deputy project scientist for GPM. A lot of the satellites providing passive microwave measurements of precipitation to the mission are tasked with different missions. For example, the instruments aboard the joint NASA/NOAA Suomi National Polar-orbiting Partnership (Suomi NPP) satellite contribute to our understanding of the ever-changing three-dimensional structure of atmospheric temperature and humidity, land cover and vegetation, and nighttime lights. Suomi NPP also provides passive microwave measurements to GPM. The combined measurements from these satellites allow GPM to provide a picture of precipitation around the world every 30 minutes.
The current constellation is anchored by the GPM Core Observatory, which was launched in 2014 by NASA and JAXA. The Core Observatory satellite has an advanced active radar instrument called the Dual-frequency Precipitation Radar (DPR) that measures both liquid and frozen water. It also has the GPM Microwave Imager (GMI) instrument, a multi-channel microwave radiometer which serves an essential role in the near-global-coverage and frequent-revisit-time requirements of GPM. Precipitation estimates from the Core Observatory satellite are used to calibrate the data from the other satellites. Data from GPM satellites are also instrumental in hurricane forecasting.
IMERG
Last year, GPM upgraded its data algorithms to calibrate and incorporate the Tropical Rainfall Measuring Mission (TRMM) data into its data record. TRMM was a research satellite in operation from 1997 to 2015. The NASA algorithm—the Integrated Multi-satellitE Retrievals for GPM (IMERG)—fuses data from the TRMM and GPM missions, giving meteorologists and researchers access to a 20-year precipitation record (from June 1, 2000 to present).
Before TRMM and GPM, researchers had to depend on less-accurate satellite infrared data for determining how much precipitation fell over the ocean or in remote areas without on-the-ground precipitation-measuring instruments. IMERG incorporates monthly surface precipitation gauge data in the "Final" data product (used for research) to correct for bias in the satellite estimates, where gauge data are available. This on-the-ground data is critical for validating measurements from satellites. Snow-covered surfaces can interfere with satellite measurements of snowfall, but on-the-ground measurements are helping GPM scientists fine-tune the IMERG algorithm.
The longer the data record, the more valuable it is to researchers and meteorologists. "We probably know more about precipitation in 1998 now than we did in 1998," said Huffman. Huffman and colleagues are working to add TRMM data back to 1998 to this record using the IMERG algorithm.
How IMERG Data Are Used
The 20-year record of IMERG data is used for studying Earth’s water and energy cycles. The record reveals where some of the wettest and driest places in the world are located. The wettest places on Earth are found over the ocean, especially off the coast of tropical countries. About 360 inches of rain falls off the northwest coast of Colombia. Just 2,000 miles south, in the Atacama desert, less than an inch of rain falls in a year.
The data are used to spot and forecast extreme events around the world, like tropical cyclones, droughts, floods, and landslides.
These data are also being used for a number of applications. For example, IMERG data have been used to help wheat farmers in developing countries reduce their use of freshwater resources to irrigate their crops when rain is expected. Microinsurance companies use the data to help low-income individuals manage their risks when their livelihoods depend on rainfall, such as in the agricultural sector. Another interesting use of IMERG data is from MoveBank, a free online platform that helps researchers manage, share, and analyze animal movement data. MoveBank uses IMERG data in their Env-DATA System, which helps ecologists link animal movement data with global environmental datasets, like weather models and satellite imagery.
Access Precipitation Data
You can access, visualize, and explore IMERG data using Earthdata Search and a number of other open-source NASA tools.
- Download IMERG data from Earthdata Search
Early, Late, and Final precipitation data are available at half hourly or 1-day temporal resolutions. Early data products (at half hourly resolution) are available about 4 hours after observation time; Late data (at daily resolution) are available about 14 hours after observation time; Final data products incorporate monthly gauge data with satellite measurements and are available about 3.5 months after the observation month. Data are available from June 1, 2000 to present in NetCDF or HDF format and can be opened using Panoply.
- Geographic Information System (GIS) analysis-ready datasets in GeoTIFF format can be accessed from the Precipitation Processing System FTPS site. After registering, access to the FTPS site is free to the user.
Explore and Visualize Precipitation Data

You can view IMERG precipitation rate data on NASA’s Worldview interactive data visualization application. Worldview shows IMERG data at a daily temporal resolution.
IMERG data products can be visualized and analyzed using the online interactive tool Giovanni. Data are available from 2000–present.
Giovanni allows users to view data as a time-averaged map, an animation, seasonal maps, scatter plots, or a time series. Follow these steps to plot data in Giovanni: 1) Select a map plot type. 2) Select a date range. Data are in multiple temporal resolutions, so be sure to note the start and end date to ensure you access the desired dataset. 3) Check the box of the variable in the left column that you would like to include and then plot the data. For more information on choosing a type of plot, see the Giovanni User Manual.