It’s an old adage that the more things change, the more they remain the same. While NASA’s Earth Observing System Data and Information System (EOSDIS) has evolved significantly since it became operational in 1994, one element remains consistent—high satisfaction with EOSDIS products and services by the global user community. This trend continues with another high aggregate score in the 2019 American Customer Satisfaction Index (ACSI) survey of EOSDIS data, products, and services.
 as a yellow bar above two blue bars representing the 2019 National CSI score (75.4) and the 2019 Federal Government CSI score (68.1).")
The EOSDIS 2019 aggregate Customer Satisfaction Index (CSI) score of 78 out of 100 is only one point lower than the record-high score of 79 received on the 2018 survey, and indicates high satisfaction with products and services. Because the CSI score is based on aggregate weighted scores in several factors that are calculated using the proprietary ACSI methodology, scores in the upper-70s can be considered an indication of “strong” performance, especially consistent scores in the 70s and 80s over multiple years.
In fact, NASA’s EOSDIS has never received a CSI score lower than 74 since the first EOSDIS ACSI survey was conducted in 2004. As in all previous surveys, and over more than 15 years, NASA’s EOSDIS outscored the federal government, which received an aggregate 2019 CSI score of 68.1. In addition, CSI scores for EOSDIS Distributed Active Archive Centers (DAACs) ranged from 74 to 83, with an average aggregate CSI of 78.
Results from the annual survey provide a roadmap for the DAACs and NASA’s Earth Science Data and Information System (ESDIS) Project (which manages EOSDIS science operations, including data archiving and distribution) on ways these products and services can further be improved and enhanced along with insight into new products that might better serve user needs.
The ACSI survey is administered by the CFI Group, an independent organization contracted by the federal government to assess user satisfaction with products and services at numerous federal entities. Along with conducting the annual NASA EOSDIS survey, the CFI Group also conducts surveys for the National Weather Service, the General Services Administration, and the U.S. Department of Education, among others.
The ACSI model used by the CFI Group to conduct the annual survey is a set of causal equations linking customer expectations, perceived quality, and perceived value to customer satisfaction, which is reflected numerically in the CSI score. Satisfaction, in turn, is further linked to a customer’s likelihood to recommend products and services and their willingness to use products and services in the future.
One expected result of high customer satisfaction with services is user trust and loyalty. This is accounted for in the ACSI algorithm and reflected by a number indicating the likelihood of a respondent to recommend the evaluated products and services to others coupled with the likelihood of a respondent to use the services in the future. Respondents’ likelihood to recommend EOSDIS products and services (86 out of 100) and likelihood to use EOSDIS services in the future (87 out of 100) are both two points lower than in the 2018 survey, but remain very strong and are consistent with previous surveys.
ESDIS, which coordinates and facilitates the annual ACSI survey, opted to use a “short-form” abridged version of previous survey questionnaires for the 2019 survey. One benefit of this shorter survey was a significantly larger pool of completed surveys (6,337 completed surveys were received in the 2019 survey vs. 2,778 completed surveys in 2018). This higher response pool lends further credence that the 2019 survey accurately reflects user satisfaction. Starting with the 2019 survey, the ESDIS Project will alternate short-form surveys with more detailed longer surveys as a way to maintain continuity with past questions from the longer survey (e.g., the 2020 survey will be a long-form survey; the 2021 survey will use the short-form, etc.).
The 2019 survey was conducted online between October 7 and November 1. The CFI Group emailed approximately 285,698 survey invitations to individuals who used EOSDIS data and/or products in the past year. The 6,337 completed surveys represent a 2.2% response rate and a large enough sample size for calculating a statistically valid CSI score, according to the CFI Group (the five-year average response rate for the EOSDIS ACSI survey is 2.64%).
Outside of three survey questions required by the CFI Group asking respondents to rate their overall expectations, perceived quality, and perceived value of EOSDIS services and products on a 1 to 10 scale (which are used to calculate the CSI score), the remaining questions on the EOSDIS survey were developed collaboratively by the ESDIS Project, the DAACs, and the CFI Group. Respondents to the survey are asked to evaluate their experience with the specific DAAC or DAACs from which they receive data and products, and were allowed to skip questions not related to their specific experience with the specified DAAC.
The survey also allows respondents to provide open-ended comments. These are some of the most valuable areas of the survey since they enable respondents to candidly express their specific likes, dislikes, satisfactions, and suggested improvements.
In the following summary tables, total percentages may not equal 100% due to survey questions allowing for multiple responses; all non-percentage values are out of 100. Click on any image for a larger view.
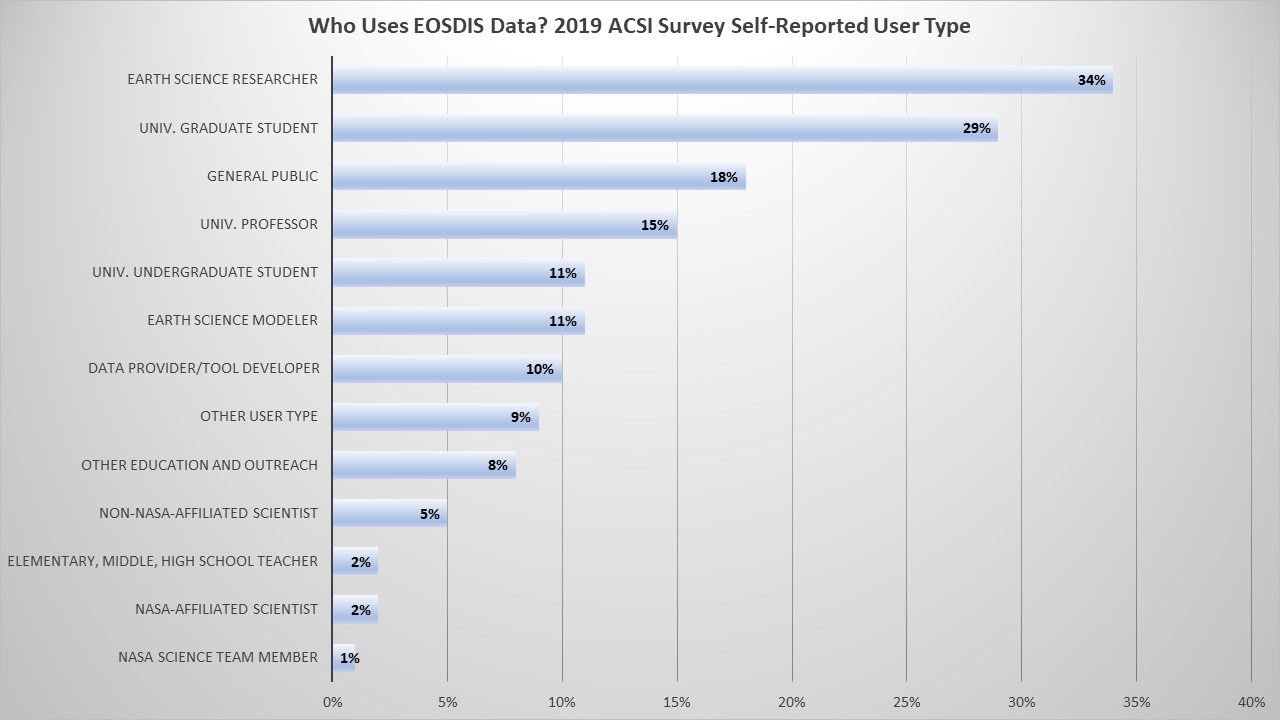
As in previous surveys, respondents self-identifying themselves as university students (40%)—which includes undergraduate (11%) and graduate (29%) students—and Earth science researchers (34%) are the most common EOSDIS data users. In a reversal from the 2018 survey, EOSDIS data users were followed by the general public (18%, up from 13% in the 2018 survey) then by university professors (15%, unchanged from the 2018 survey).
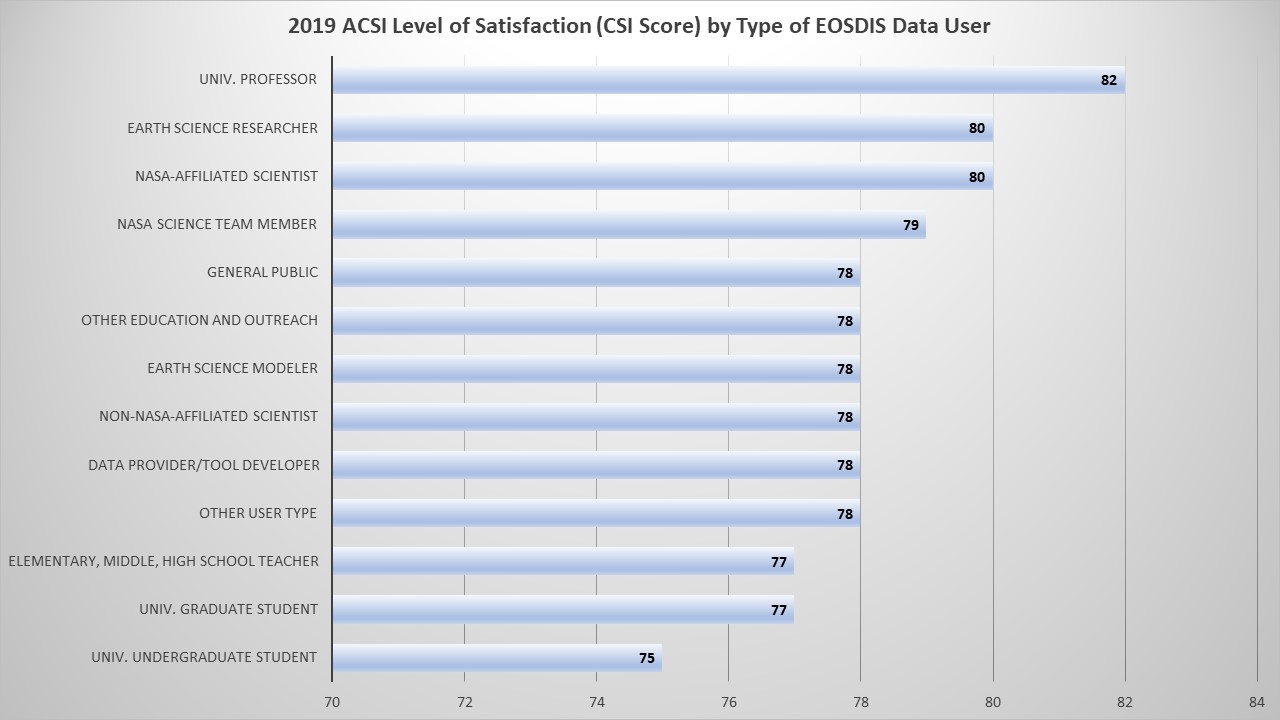
University professors report the highest satisfaction with EOSDIS products and services, with a 2019 CSI of 82, the highest of any user type. University undergraduate students indicate the lowest satisfaction with EOSDIS products and services, with a CSI score of 75 (which is still considered a “strong” score, based on the survey methodology).
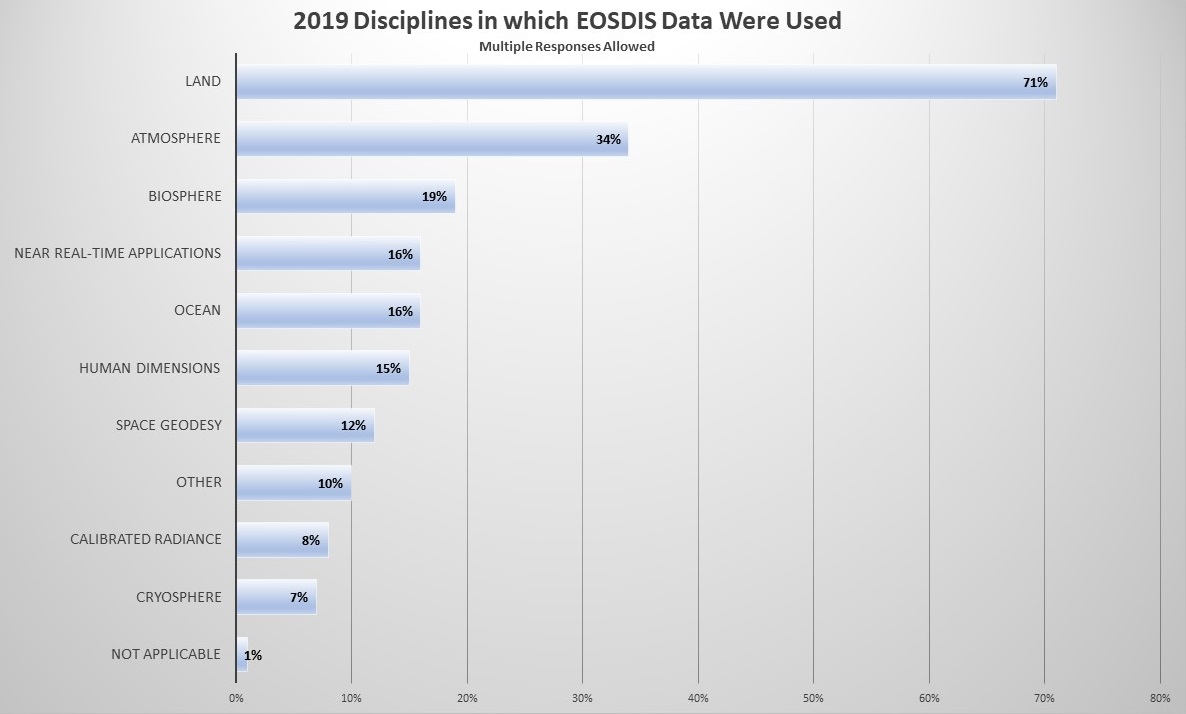
The disciplines in which EOSDIS data were used in 2019 are consistent with previous years. Respondents indicating their use of EOSDIS data for land-related studies remains the overwhelming discipline in which EOSDIS data are used (71%), while other disciplines noted by survey respondents remain either unchanged or within 2% of 2018 values. As noted by the CFI Group, there is little variation in satisfaction (CSI score) among the different areas and disciplines in which EOSDIS data are used.
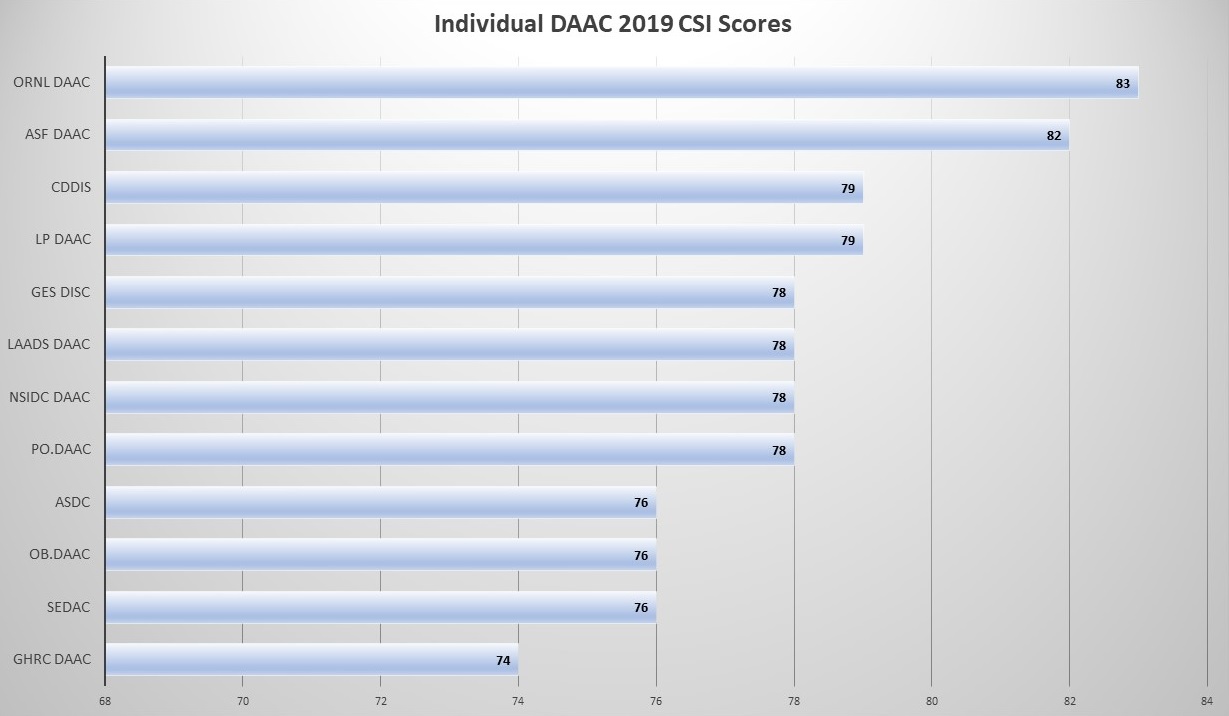
Each year, ACSI survey respondents are asked to evaluate their experience and satisfaction with the specific DAAC or DAACs from which they receive data, products, and services, and CSI scores were computed for each DAAC based on individual DAAC survey responses. All DAACs achieved CSIs between 74 and 83, with a strong average aggregate DAAC CSI of 78. NASA’s Atmospheric Science Data Center (ASDC) and Oak Ridge National Laboratory DAAC (ORNL DAAC) both saw two-point CSI increases, the largest increase of any DAACs with at least 100 evaluations in the 2019 survey (while NASA’s Ocean Biology DAAC [OB.DAAC] saw the largest change in CSI score between 2018 and 2019 [+9 points], it also had the fewest evaluations of any DAAC in the 2019 survey [77]).
Want to participate in future ACSI surveys? Anyone downloading data from an EOSDIS DAAC during the year will automatically be added to the survey list. You also can visit the DAAC or DAACs from which you acquire data and request your email address to be added to the list of survey recipients. Thanks to your participation, the evaluations and comments from the 2019 EOSDIS ACSI survey are being incorporated into enhancements to existing products and services as well as into the development of new products and services. While this might mean changes to products and services based on your indicated needs, the ESDIS Project and the DAACs are confident that the high quality of these products and services will continue. In fact, there are more than 15 years of annual surveys proving this.
Read more
A summary of the 2019 EOSDIS ACSI report along with summaries of all EOSDIS ACSI surveys dating back to the first survey in 2004 are available on the ACSI Reports page in the System Performance and Metrics section of the Earthdata website. Full reports are available upon request to ESDIS.