Forests are one of the world’s largest banks of carbon-rich biomass. This is why when researchers mapped biomass in the past, they typically focused on the world’s forests. But this approach leaves out considerable amounts of biomass in grasslands, shrublands, croplands, and other biomes. New maps, published at NASA's Oak Ridge National Laboratory Distributed Active Archive Center (ORNL DAAC) and described in Nature Scientific Data, combine remotely sensed biomass data for different land cover types into harmonized global maps of above and belowground biomass for the year 2010.

“People often conflate forest biomass with total biomass,” said Seth Spawn, lead author of the research and doctoral candidate at the University of Wisconsin, Madison. “Researchers have spent a lot of time developing nice remotely sensed maps of aboveground forest biomass, but they intentionally omit other land covers and the carbon stored below ground in plant roots. We haven’t had the whole picture.”
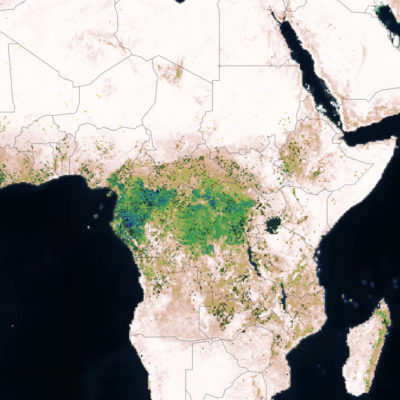
Spawn and his team combined maps of forest biomass with other land cover specific biomass maps that use remotely sensed data. They allocated fractional contributions to a given grid cell using data on land cover, percent tree cover, and the presence of secondary vegetation. These maps show a sizable stock of biomass outside of forested areas, especially in the trees located in savannas and farm fields.
“There’s more carbon on croplands than I would have expected,” said Spawn. Trees on orchards and farms practicing agroforestry have a carbon stock that is overlooked in previous biomass maps. Globally, trees on croplands stored about 28 metric gigatons of carbon in 2010, which is 7 percent of the total stock of carbon in plants, according to these new maps.
The team produced maps of uncertainty with the data they used and published them along with the dataset.
Published in March, the dataset is already being used for a number of applications. Researchers are using the dataset in integrated assessment models that incorporate economics and the Earth system. It is also being used to model carbon emissions from past and potential land use changes and the carbon impacts of bioenergy transitions.
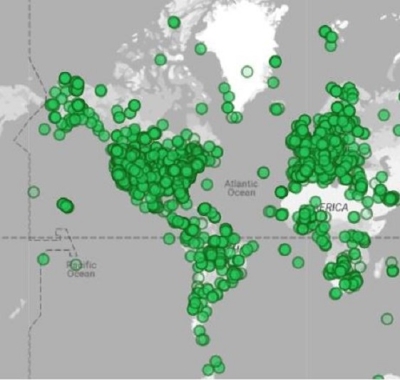
Spawn and colleagues also used preliminary findings from this research to identify places with high carbon stocks and biodiversity. “There are certain areas, the ‘hotspots,’ where biodiversity and carbon density align,” Spawn said. “Identifying these areas can help governments and resource managers prioritize land for protection.”
Read more about the data in Nature Scientific Data. You can download the data, Global Aboveground and Belowground Biomass Carbon Density Maps for the Year 2010, from Earthdata Search or ORNL DAAC.