Water is the most abundant substance on Earth and a critical component of the water, carbon, and energy cycles that drive our planet. According to the USGS, water covers more than 70 percent of Earth, with an estimated total volume of 1.386 billion km3 (about 333 million miles3). While this is a lot of water, almost 97 percent of it is in the oceans and has high concentrations of salt. The non-saline freshwater we need to survive makes up only about 3 percent of water on Earth.
While this still is a lot of water, almost 70 percent of this freshwater is locked up in glaciers and icebergs. This leaves only about 30 percent of the freshwater as water that we easily can use. As a result, it is vital to know how much of this limited resource is available at a given time, in a given place, and in a given state (frozen, liquid, or water vapor).
Soil moisture makes up only about 0.05 percent of freshwater, but it plays a key role in weather and climate, runoff potential and flood control, soil erosion and slope failure, reservoir management, geotechnical engineering, and water quality. Being able to track the changes in soil moisture and the state in which it exists allows for better responses to natural hazards like droughts and floods as well as more effective management of agricultural production.
The public release of data products from NASA’s Soil Moisture Active Passive (SMAP) mission provides a valuable new resource for global measurements and assessments of water in the soil and the state in which this water exists. Over SMAP’s planned three-year primary mission, this global insight into the changes in soil moisture and freeze/thaw states will contribute to a greater understanding of how water drives our planet and affects our society.
Turning raw data collected by instruments on a spacecraft orbiting 685 km (about 426 miles) above Earth into more than a dozen data products and getting these products to users through NASA’s Alaska Satellite Facility Distributed Active Archive Center (ASF DAAC) and National Snow and Ice Data Center DAAC (NSIDC DAAC) is a complex undertaking. For the SMAP team, the release of public soil moisture and freeze/thaw data marks not only the end of more than a half-decade of work, but the start of a challenging period of making sure these data and data products are delivered on time and provide the quality expected by data users around the world.

The “Golden Lasso”
Launched on January 31, 2015, the distinguishing characteristic of the SMAP spacecraft is its large gold-coated mesh antenna. The 6 meter (almost 20 foot) diameter antenna spins at up to 14.6 revolutions per minute and covers a 1,000 km (621 mile) ground swath. Repeat coverage at any given site is provided every two to three days, depending on latitude.
The SMAP spacecraft carries two instruments: a synthetic aperture radar, which is the active sensor, and a radiometer, which is the passive sensor. The mission design was to combine the high accuracy of the radiometer and the high spatial resolution of the radar to produce high quality measurements at an intermediate spatial resolution.
These plans changed when SMAP’s radar unexpectedly stopped transmitting radar pulses after two-and-a-half months of flawless data collection. According to NASA, the problem was attributed to a low-voltage power supply in the radar’s high-power amplifier. “As far as the data user is concerned, they have two-and-a-half months of good radar data, and the team is working diligently to produce the best calibrated version of these data that they can,” says SMAP Deputy Project Scientist Peggy O’Neill. O’Neill is quick to note that SMAP’s radiometer continues to work fine, and is returning valuable data for scientific research and analysis. “I don’t think we’ve had to change our focus in terms of the value of the science objectives and the value of the science data we’re producing to the community,” she adds.
SMAP Data and Data Products
The SMAP team used the first year in orbit to conduct an extensive calibration/validation program to ensure that accurate, scientifically valid data could be produced. This period included not only data acquisition, but also comparisons with similar data collected by the European Space Agency’s (ESA) Soil Moisture and Ocean Salinity (SMOS) satellite along with data correlation with in situ ground measurements of soil moisture, data analysis, and performance evaluations. Further calibration/validation will be conducted this summer during a 45-day field campaign in Iowa and Manitoba, Canada. “Calibration is understanding instrument output given known instrument inputs,” says Jeff Piepmeier, the SMAP Radiometer Instrument Scientist. “We have different parameters in the algorithm that have uncertainties in their values, so we have to adjust these parameters to get the best calibrated data out of the instrument.”
After raw data are collected, they are downloaded and sent to SMAP’s Science Data System (SDS) for processing. The SDS produces 16 distributable standard data products representing four levels of data processing. SMAP uses the data level descriptions from NASA’s Earth Observing System Data and Information System (EOSDIS).
SMAP’s SDS is housed primarily at NASA’s Jet Propulsion Laboratory (JPL) in Pasadena, CA. The JPL SDS is responsible for generating Level 1 radar and radiometer instrument data products and Level 2 and 3 geophysical data products. NASA’s Goddard Space Flight Center in Greenbelt, MD, houses components of the SMAP SDS and is responsible for generating Level 4 value-added (model-based) geophysical data products. Goddard also is responsible for the Level 1 radiometer science algorithm, which is implemented in the SDS at JPL and used for calibration/validation of the radiometer data.

The start of the SMAP data record will be March 31/April 1, 2015. This is the date the SMAP radiometer first started collecting routine science data (the SMAP radar was not in its final data configuration until mid-April). As of April 2016, validated Level 1 radar and radiometer products are available, along with beta versions of Level 2 through Level 4 soil moisture and freeze/thaw products. Validated versions of the geophysical products will be released on April 29, 2016.
The SMAP team currently is working on a new Level 3 freeze/thaw product based on radiometer data that will provide freeze/thaw data for dates after the failure of the radar on July 7, 2015. A beta version of this new product is expected to be released to the public in December 2016, according to O’Neill, with a validated product released by May 2017. In the meantime, two-and-a-half months of Level 3 freeze/thaw active product based on radar data collected from April 24, 2015, until the radar failure will be validated and released to the public on April 29, 2016.
O’Neill notes that it is important to understand what is meant when a validated product is released. “When we say the validated data are going to be released, this means that the [SDS] that produces these data is going to implement the validated version of the algorithm for that specific data product in a forward processing mode,” she says. “In parallel with this, they are going to go back and use this validated algorithm to re-process all the previous data back to the start of the mission.”
SMAP Radiometer and Radar Data Status
While the SMAP radiometer continues to provide an ever-growing collection of valuable data (and just passed one year of data collection), the loss of the SMAP radar will impact some SMAP data products, mainly the freeze/thaw products and the active/passive soil moisture product.
Data products produced using the two-and-a-half months of data from SMAP’s radar will have a resolution of 3 km (1.86 miles). However, this high resolution is not achievable using the radiometer. The resolution of the new Level 3 freeze/thaw radiometer-based product would be about 40 km (about 25 miles) if just the standard radiometer brightness temperature (TB) is used. However, to improve this resolution further, the SMAP team is working on an enhanced resolution radiometer product that is expected to increase the spatial resolution of the TB product to about 25 km (15.5 miles), according to O’Neill. The beta version of this product is expected to be available by December 2016 and will be used to generate the Level 3 freeze/thaw passive product with an approximate spatial resolution of 25 km (15.5 miles) that will be posted on a 9 km (5.6 mile) grid.
The radar team also is exploring the option of replacing the data that would have been collected by SMAP’s L-band radar with data from another orbiting radar. The best candidate radars currently in orbit are the C-band radars on ESA’s two Sentinel spacecraft. “SMAP is in discussion with ESA to use C-band radar data from both Sentinel-1A and Sentinel-1B as a replacement for the SMAP L-band radar in the combined active-passive soil moisture product [L2_SM_AP],” says O’Neill. If SMAP/Sentinel 3 km (1.8 mile) and 9 km (5.6 mile) active-passive soil moisture products are produced, beta versions will be publically available around March 2017, according to O’Neill. However, the spatial coverage and latency of these C-band-based products will be lower than what would have been achieved through the SMAP L-band radar.
From SMAP to DAAC
Processed SMAP data products are sent from the SMAP SDS to NASA’s ASF DAAC and NSIDC DAAC for archiving and distribution. ASF DAAC houses all Level 1 radar products, while NSIDC DAAC is responsible for all Level 1 radiometer products and all radar- and radiometer-based Level 2-4 geophysical products. Data users can download SMAP data products after completing a simple online registration to establish a NASA Earthdata Login. Along with data, ASF DAAC and NSIDC DAAC also provide links to SMAP validation data and tools to view and use SMAP data.
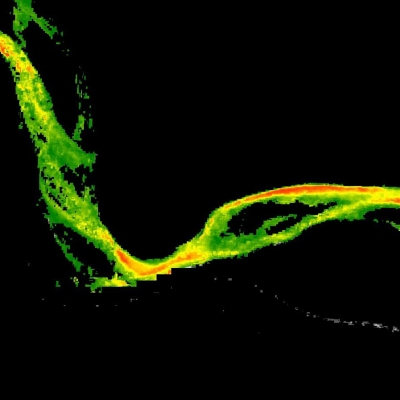
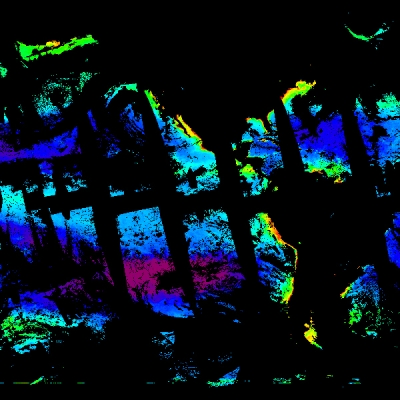
In addition, images of SMAP data products are available through NASA’s Global Imagery Browse Services (GIBS). SMAP Level 1-4 products currently are available through GIBS for viewing using the EOSDIS Worldview browsing and visualization client.
 product from 10 April 2016. Image: NASA Worldview.")
Next Steps for SMAP Data and Data Products
Even after the release of validated data products to ASF DAAC and NSIDC DAAC, the SMAP team will stay busy. “We will continue to try to maintain and improve the calibration of the products throughout the three-year SMAP primary mission life,” O’Neill says. “Just because we’re putting out calibrated and validated products doesn’t mean our job is over.”
For now, the team is enjoying the end result of more than a half-decade of hard work—the public release of SMAP data products.
“It’s probably been the most important thing I’ve done so far at NASA,” says Piepmeier about his work on SMAP’s radiometer. “It reaches all the way back to my graduate research in terms of the architecture and the instrument. It’s been great to see this work applied to a space flight instrument.”
O’Neill stresses that even with the loss of the radar, the mission is still on track to provide valuable data and data products. “I think SMAP as a project is in very good shape,” she says. “Everyone was very disappointed when the radar failed, but there was no pointing fingers; everyone rolled up their sleeves and looked for ways to bring value back to the community. I think ultimately we’ll be very successful.”
Resources for SMAP Data & Data Products