Accurate predictions of where and when a hurricane will make landfall are critical. Combined with improved decision support systems they allow emergency management and the public more time to prepare. A recent study reviewed the impact of satellite data in accurately forecasting the path of Hurricane Sandy. The study showed that Atmospheric Infrared Sounder (AIRS) Near Real-Time (NRT) data from NASA’s polar-orbiting satellites significantly improved these predictions.
. Click to view larger image.")
Forecasting Hurricane Sandy
Hurricane Sandy is considered the second costliest hurricane to make landfall in the US, after Hurricane Katrina. In the United States, it caused tens of billions of dollars in damage and dozens of deaths.
Sandy originated as a tropical storm in the Caribbean on October 19, 2012. It was upgraded to a hurricane on October 24 as it tore through the Caribbean, making landfall in Jamaica. Sandy gained strength over open water and became a Category 2 hurricane before hitting Cuba on October 25, and sweeping across the Bahamas on October 26. It briefly weakened to a tropical storm on October 27 before turning north toward the U.S. coast. Sandy gained strength again to become a Category 1 hurricane making landfall near Atlantic City, New Jersey, in the United States at the night of October 29.
What made Sandy unusual was the sudden “left-hook” of the storm towards the New Jersey coast, which was almost unprecedented and challenged many Numerical Weather Prediction (NWP) systems. The European Centre for Medium-Range Weather Forecasts (ECMWF) made excellent forecasts of Sandy’s landfall providing some warning signals 7 - 8 days in advance. To better understand the role of satellite observations in the successful forecasting of the event, a group of scientists at ECMWF recently performed a number of experiments. The experiments are called Observation System Experiments (OSEs), assessed the value of individual observations in the NWP system.
 and the control system (red and black solid)")
Observation System Experiments
In the study, a control system is run using all available conventional observations and satellite observations. The forecasts from the control system run are almost identical to the observations of Sandy’s path. The forecasts are then run withholding different satellite observations to determine their impact. In these denial experiments, first polar-orbit (NOPOLAR) and then geostationary (NOGEO) satellite observations are withheld from 00UTC October 20, 2012 onward. The NWP systems are then cycled without these data for 5 days until 00UTC October 25, 2012 after which forecasts are launched each day till October 30 when Sandy made landfall. These particular dates are chosen as the 5-day operational forecasts from October 25. The results of the study (McNally et al. 2014) show that the NOPOLAR forecast deviates dramatically from the control system and fails to capture the sudden westward turn to Jersey coast (Fig. 2). The forecast from NOGEO experiments is very close to that of control system and not shown here. The impact of polar-orbit satellite observations is so remarkable that without them, ECMWF system would not give useful guidance 5 days ahead.
Figure 3 shows the 5-day and 4-day forecasted tracks of Sandy from NOPOLAR (red) and control system (black). The track differences look even more impressive. The landfall location from NOPOLAR experiment is near Boston area, and more than 500km further north from the actual landfall point. The green dot track is the forecast from the experiment of NOPOLAR but with modified background errors in the Ensemble of Data Assimilation (NOPOLAR-EDA). It has the potential of recovering some losses from polar-orbit satellite observations but not always, and does not produce better predication over longer range of 6 days and beyond. In summary, the satellite observations, especially the polar-orbit satellite observations, play a very important role in the successful forecast of Sandy.
 and 4-day (right) forecasted tracks of Sandy from NOPOLAR (red), NOPOLAR-EAD (green), and control system (black)")
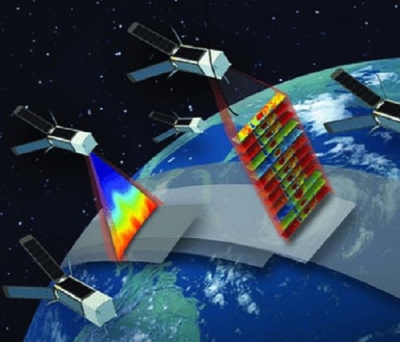
Near Real-Time Data
NASA's Earth Observing System Data and Information System (EOSDIS) is a key core capability in the Earth Science Data Systems (ESDS) Program. As a part of EOSDIS, The Land, Atmosphere Near real-time Capability for EOS (LANCE) provides many NRT products within 3 hours from satellite observation. AIRS is the first high spectral resolution infrared spectrometer on the Aqua polar-orbiting satellite launched in May 2002. AIRS, along with its companion microwave instrument, the Advanced Microwave Sounding Unit (AMSU), form the integrated atmospheric sounding system. Many studies demonstrate the beneficial impact of AIRS for improving global analysis and weather forecasting (Chahine et al., 2006, Marshall et al., 2006). AIRS and AMSU NRT data are fed to the European Centre for Medium-range Weather Forecasts (ECMWF) Numerical Weather Prediction (NWP) system through LANCE data stream. The individual instrument denial experiment in the ECMWF study indicates that removing infrared and microwave radiance observation degrades analysis most significantly, hence AIRS and AMSU data are key satellite observations contributing to the successful forecasting of Sandy. Figure 4 shows one granule image of AIRS level 1B data on October 29, 2012. The very low brightness temperature (blue and purple color) areas illustrate Sandy’s wide circular rain band and intensive core.

The Goddard Earth Observing System Model, Version 5 (GEOS-5) is a system of models being developed in NASA's Global Modeling and Assimilation Office (GMAO) to support NASA's earth science research in data analysis, observing system modeling and design, climate and weather prediction, and basic research. GEOS-5 also acquires AIRS NRT data through LANCE data stream and assimilates the data. Figure 5 is the 6-day animation of GEOS-5 forecasted surface level pressure (SLP) and precipitation rate along with the actual track of Sandy (View the Figure 5 animation). Overall GEOS-5 makes a very good prediction of Sandy as well.
In addition to AIRS, LANCE provides NRT imagery and data products from the Moderate Resolution Imaging Spectroradiometer (MODIS), Ozone Monitoring Instrument (OMI), and Microwave Limb Sounder (MLS). These products support application users interested in monitoring and analyzing a wide variety of natural and man-made phenomena.
Acknowledgements
The author thanks Diane K. Davies and Minnie Wong of LANCE team for very valuable comments and editing, and Andrey K. Savtchenko of AIRS team for providing GEOS-5 forecast animation in Fig. 5.
References
LiveScience website: http://www.livescience.com/24380-hurricane-sandy-status-data.html
McNally, T., M. Bonavita, and J.-N., Thepaut, 2014: The Role of Satellite Data in the Forecasting of Hurricane Sandy. Mon. Wea. Rev., 142, 634-646, doi: 10.1175/MWR-D-13-00170.1
Chahine, M. T., et al., 2006: AIRS improving Weather Forecasting and Providing New Data on Greenhouse Gases. Bull. Amer. Meteoro. Soc., 87, 911-926, doi: 10.1175/BAMS-87-7-911
Le Marshall, J., et al, 2006: Improving Global Analysis and Forecasting with AIRS. Bull. Amer. Meteoro. Soc., 87, 891-894, doi: 10.1175/BAMS-87-7-891
For more information
Earth Observing System Data and Information System (EOSDIS)
Land, Atmosphere Near real-time Capability for EOS (LANCE)
Atmospheric Infrared Sounder (AIRS) Near Real-Time (NRT) data
Global Modeling and Assimilation Office (GMAO)