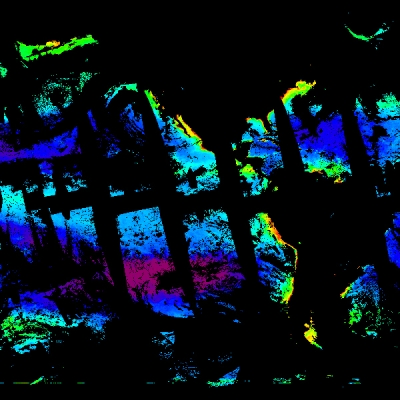
In October 2016, an aircraft equipped with NASA's Airborne Visible Infrared Imaging Spectrometer - Next-Generation (AVIRIS-NG) instrument detected multiple massive methane plumes coming from the Sunshine Canyon Landfill near Santa Clarita, California. The plumes were large enough that researchers conducting the flight out of NASA’s Jet Propulsion Laboratory in Pasadena, California, notified facility operators and local enforcement agencies about it.
This flight was part of the California Methane Survey, an ongoing project to map sources of methane emissions around the state. These measurements were taken to improve greenhouse gas accounting in California and to pinpoint major mitigation opportunities. New technologies developed by researchers funded by NASA’s Advancing Collaborative Connections for Earth System Science (ACCESS) Program allowed results from the survey to be provided to decision makers within weeks of the flights.
Methane is a short-lived but powerful greenhouse gas (GHG) that has been responsible for about 20% of anthropogenic warming since the industrial revolution. The state of California aims to reduce methane emissions by 40% from 2013 levels by 2030. But in order to reduce emissions of this pernicious greenhouse gas, the state needed to get a better handle on the sources of these emissions.
Methane Source Finder
The California Air Resources Board, or CARB, is the state agency that oversees air pollution control efforts in California. The agency estimates greenhouse gas emissions by tallying up all the emitting activities around the state. But this inventory approach can miss leaks or other fugitive emissions, so CARB became interested in measuring emissions from the air.
Before any flights were planned for the methane survey, Dr. Francesca Hopkins, assistant professor of climate change and sustainability at the University of California, Riverside, undertook a major research effort to map all potential sources of methane around the state. In 2015, Hopkins teamed up with Riley Duren, a research scientist at JPL (now at the University of Arizona) and they were awarded ACCESS funding to map all infrastructure in California capable of emitting methane and develop new technologies to streamline the processing of methane observations from the AVIRIS-NG instrument.

The first step was mapping potential sources of emissions so that researchers didn’t have to do this by hand. During previous field studies, the team would analyze the AVIRIS-NG data to retrieve atmospheric methane concentrations, identify methane plumes from individual emitters, and then try to pinpoint the source of the plumes by analyzing satellite photos of what was underneath. This process had too much “human in the loop,” Hopkins said, and it would take months to analyze the images from each flight.
To make this process more efficient, Hopkins decided to map all potential sources of methane around the state, using a GIS-based approach, so that plumes could be attributed to sources within days. Hopkins and her colleagues brought together many publicly available geospatial datasets of potential methane emitting infrastructure to develop this map.
Here’s where the cow manure comes in.
Dairy cows and beef cattle produce methane through their guts: enteric fermentation in their specialized digestive tracts results in methane burps. Their manure also produces methane, and when it is stored in manure lagoons with anaerobic conditions, these lagoons can be a major source of emissions. Oil and natural gas production releases methane trapped underground. Infrastructure to store and transport natural gas can leak. Landfills are a source of methane when organic materials break down in anaerobic conditions. “Basically, we looked at every source we thought could possibly emit methane,” said Hopkins.
The research team organized potential methane-emitting infrastructure in California into three sectors (energy, agriculture, and waste) following the frameworks used by the State of California GHG Inventory and the Intergovernmental Panel on Climate Change (IPCC) Guidelines for GHG Reporting. The dataset, which is called Sources of Methane Emissions (Vista-CA), contains over 900,000 entries and is available at NASA’s Oak Ridge National Laboratory Distributed Active Archive Center (ORNL DAAC).
The Vista-CA dataset was critical to the California Methane Survey because it identified all potential methane-emitting infrastructure in the state that remote sensing could detect so that flights were planned to prioritize areas with potential to have the most methane emissions.
California Methane Survey and Machine Learning
From August 2016 to November 2017, JPL flew aircraft equipped with the AVIRIS-NG instrument over 22,000 square miles of the state for the California Methane Survey, an effort jointly funded by NASA, CARB and the California Energy Commission. The flight paths were planned so that they would cover at least 60% of methane point-source infrastructure mapped in the Vista-CA dataset. “Currently there is no methane observing system that can efficiently survey the entire land surface at high resolution,” said Duren. “We had to focus on high-priority areas.”

These flights generated a lot of data. The AVIRIS-NG instrument measures methane at a high spatial resolution, about 3 meters per pixel at the typical survey altitudes of 3 km. A five-hour flight with the AVIRIS-NG instrument can generate about a terabyte of data. If a human were to look for methane plumes in that amount of data, it would take many months to analyze, noted Duren. “If the latency of these airborne projects is measured in months and years, then the data are not very useful to the average decision maker,” said Duren.
To speed up data analysis, Duren’s team used machine learning techniques such as neural networks to automatically identify plumes from these flights so that processing only took a matter of days. In parallel, Hopkins’ graduate student, Talha Rafiq, developed an algorithm to attribute previously validated methane plume observations to the most likely Vista-CA source with 99% accuracy. These technologies allowed the team to share their findings with facility operators and regulators in California for subsequent campaigns within weeks of the flights to alert them of fugitive methane emissions and help accelerate leak repair.
Of the 272,000 individual facilities and equipment components covered repeatedly by the survey, emissions from less than 0.2% of that infrastructure were responsible for at least a third of California’s methane inventory. Landfills and composting facilities were responsible for 41% of the emissions measured. Duren, Hopkins, and others published these findings in Nature in 2019. Rapid identification of methane super-emitters offers a significant contribution to helping California meet its climate goals.
In the case of Sunshine Canyon Landfill, the operator confirmed the methane emissions and determined they were due to problems with surface cover and gas capture systems. Over the next year the operator instituted a number of changes that dramatically reduced emissions. Subsequent flyovers with AVIRIS-NG confirmed a corresponding reduction in methane. After these improvements were made, the operator found there were fewer odor complaints for that facility.

“This new remote sensing technology addresses the continuing need for detailed, high-quality data about methane,” said California Air Resources Board Chair Mary D. Nichols, when the study was published. “It will help us and the Energy Commission develop the best strategies for capturing this highly potent greenhouse gas.”
Building on the success of this project, Duren recently started a nonprofit organization called Carbon Mapper to pinpoint and measure point-sources of methane and carbon dioxide globally. Planet, with assistance from JPL, is providing the first two Carbon Mapper satellites, which are scheduled for a 2023 launch.
The data from the survey can be viewed on the Methane Source Finder portal and downloaded from ORNL DAAC.
Data Products Referenced
Hopkins, F.M., Rafiq, T. & Duren, RM. 2019. "Sources of Methane Emissions (Vista-CA), State of California, USA." ORNL DAAC, Oak Ridge, Tennessee, USA. doi:10.3334/ORNLDAAC/1726.
Thorpe, A.K., Bue, B.D., Thompson, D.R. & Duren, R.M. 2019. "Methane Plumes Derived from AVIRIS-NG over Point Sources across California, 2016-2017." ORNL DAAC, Oak Ridge, Tennessee, USA. doi:10.3334/ORNLDAAC/1727.
Read About the Research
Duren, R.M., Thorpe, A.K., Foster, K.T., et al. 2019. California’s methane super-emitters. Nature, 575: 180-184 [doi:10.1038/s41586-019-1720-3].
Cusworth, D.H., Duren, R.M., Thorpe, A.K., et al. 2020. Using remote sensing to detect, validate, and quantify methane emissions from California solid waste operations. Environmental Research Letters, 15(5) [doi:10.1088/1748-9326/ab7b99].
Rafiq, T., Duren, R.M., Thorpe, A.K., Foster, K., Patarsuk, R., Miller, C.E. & Hopkins, F.M. 2020. Attribution of methane point source emissions using airborne imaging spectroscopy and the Vista-California methane infrastructure dataset. Environmental Research Letters, 15(12) [doi:10.1088/1748-9326/ab9af8].