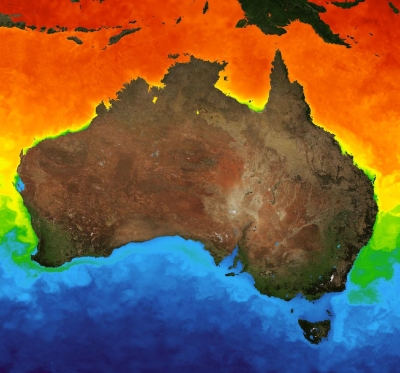
The global average sea level is rising, and this trend has been tracked since 1993 using instruments aboard Earth observing satellites. A new animation created by NASA’s Physical Oceanography Distributed Active Archive Center (PO.DAAC) combines data from four satellite-borne instruments to dramatically show 26 years of sea level change (note that there is no audio with this animation).
The data in the animation come from the following missions: the joint NASA/French Space Agency (CNES) Ocean Surface Topography Experiment (TOPEX/Poseidon; operational 1992 to 2006); the joint NASA/CNES Jason-1 (operational 2001 to 2013); the joint NASA/CNES/NOAA/European Organisation for the Exploitation of Meteorological Satellites (Eumetsat) Ocean Surface Topography Mission/Jason-2 (OSTM/Jason-2; operational 2008 to 2019); and the joint NASA/CNES/NOAA/Eumetsat Jason-3 (operational 2016 to present). The primary instrument aboard these satellites is an altimeter that measures ocean surface height.
NASA’s PO.DAAC archives and distributes data in NASA’s Earth Observing System Data and Information System (EOSDIS) collection related to the physical processes and conditions of the global oceans.
Learn more:
Explore global average sea level trend and sea surface height anomaly data at NASA’s PO.DAAC:
- Global Mean Sea Level Trend from Integrated Multi-Mission Ocean Altimeters TOPEX/Poseidon Jason-1 and OSTM/Jason-2 Version 4.2 (doi: 10.5067/GMSLM-TJ142)
- MEaSUREs Gridded Sea Surface Height Anomalies Version 1812 (doi: 10.5067/SLREF-CDRV2)
A recent Data User Profile shows how Dr. Philip Thompson, Director of the University of Hawai‘i Sea Level Center (UHSLC), uses these data in his work and research.
Learn more about NASA sea level observations: https://sealevel.nasa.gov/


