Image In-Depth

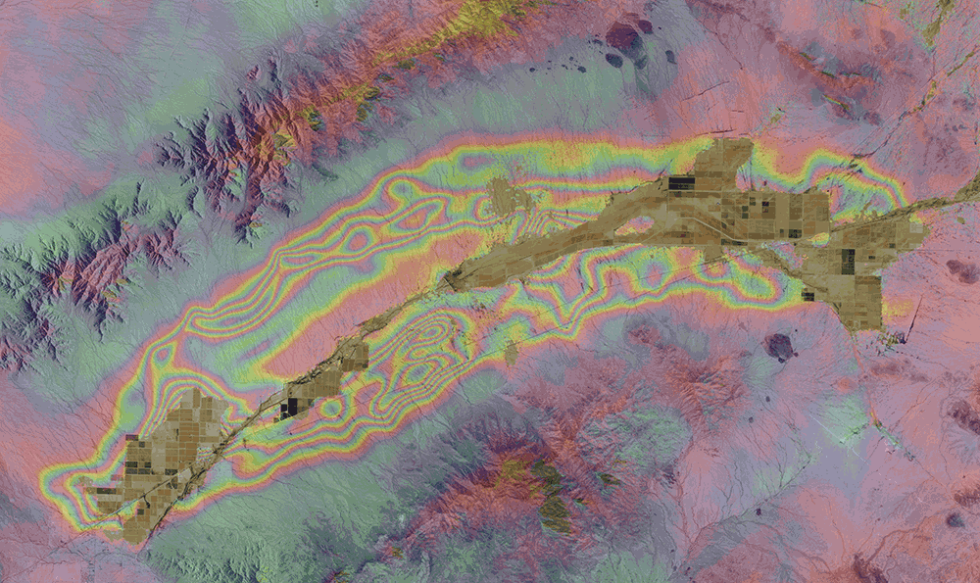
The colored bands in this interferogram show the gradual sinking of land (subsidence) in Arizona’s McMullen Valley Groundwater Basin between April 2010 and May 2015. The McMullen Basin is an agricultural area located about 100 miles (161 km) west of Phoenix, AZ, and covers almost 650 square miles (about 1,684 square km). Groundwater levels in some areas of the basin have dropped as much as 300 feet (91 m) since the early 1940s.
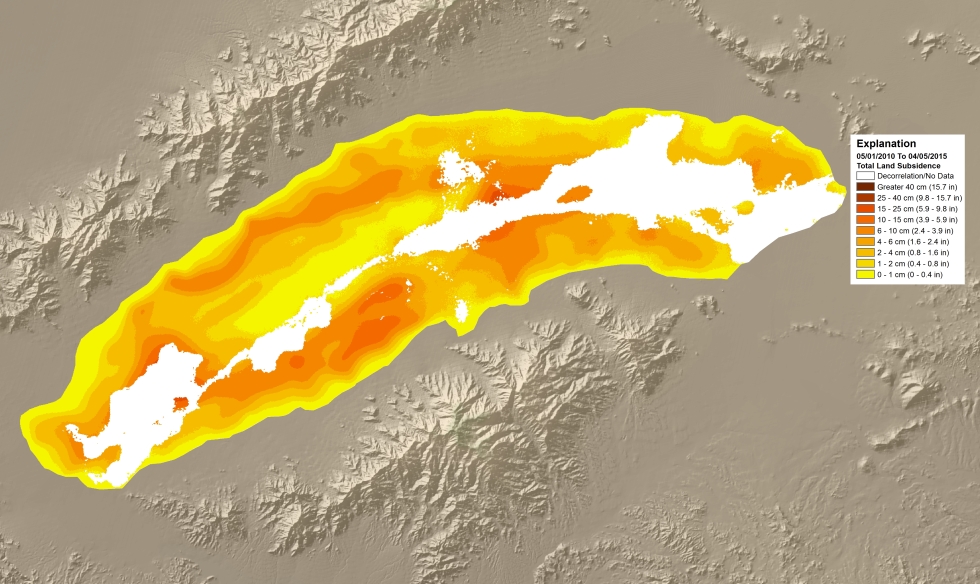
In the interferogram above, subsidence is indicated where the color sequence goes blue, red, yellow, green, blue, etc. (or any combination, but going through the colors in this order). Uplift is indicated where the color sequence goes blue, green, yellow, red, blue, etc. (or any combination, but going through the colors in this order). Subsidence is more easily seen by comparing the interferogram with a land subsidence map of the same area (below), where the darker colors indicate the areas of greatest subsidence.
The Arizona Department of Water Resources (ADWR) uses interferograms created from synthetic aperture radar (SAR) images to monitor changes in land elevation caused by the use of groundwater and to monitor changes in floodplain and drainage slopes. Over time, these elevation and drainage changes can damage infrastructure, such as highways, railways, and pipelines. You can read more about land subsidence in Arizona on the ADWR’s land subsidence page: http://www.azwater.gov/AzDWR/Hydrology/Geophysics/LandSubsidenceInArizona.htm.
Differential Interferometric Synthetic Aperture Radar (InSAR) is a technique used to measure changes on Earth’s surface to a precision of a few centimeters or less. InSAR data are used to study landform changes caused by natural events such as earthquakes, volcanic eruptions, glacier movements, and landslides as well as changes caused by human activities such as agriculture and farming, which can contribute to subsidence from groundwater use and changes in drainage patterns.
EOSDIS Resources
Data
InSAR data products are available through NASA's Alaska Satellite Facility Distributed Active Archive Center (ASF DAAC). You can download them at https://www.asf.alaska.edu/sar-data/insar/download-data.
Webinars
Real-Life Uses of Radar Data for Real-Life Scientists, Michelle Harbin, Senior Science Consultant, ASF SDC, 02/26/14


