E pluribus unum (Latin; “Out of many, one”)
A satellite is a vessel, a container for one or more instruments. With the launch of NASA’s Terra satellite on December 18, 1999, five instruments began a historic journey, a journey that has now extended more than 20 years—far beyond Terra’s six-year expected design life.
While the five individual instruments aboard Terra measure and collect data about specific properties of Earth and its interrelated systems, their combined data record represents a singular achievement in observations of our planet.
But an instrument is more than just an assemblage of sensors, mirrors, and electronics. An instrument—and the data derived from the instrument—is also an assemblage of people. While it is impossible to talk with the thousands of individuals who have been, and are, responsible for Terra’s five instruments and for ensuring the quality and validity of instrument data, conversations with Terra instrument Principal Investigators (PIs) and Science Team Leaders provide a glimpse into the significance of these instruments and the data they collect, along with how these instruments work together compiling an invaluable data record of Earth. From five instruments, one 20-year climate data record; out of many, one.
Terra

Terra is the flagship mission in NASA’s Earth Observing System (EOS). The EOS was established to acquire a long-term record of Earth observations to provide a better understanding of the total Earth system and the effects of natural and human-induced changes on the environment. Conceived in the 1980s and implemented in the 1990s, NASA’s EOS comprises an integrated constellation of satellites, a science component, and a data system. EOS data are the responsibility of NASA’s Earth Observing System Data and Information System (EOSDIS) and are managed by NASA’s Earth Science Data and Information System (ESDIS) Project, both of which are part of NASA’s Earth Science Data Systems (ESDS) Program.
Terra’s mission is to explore the connections between Earth’s atmosphere, land, snow and ice, ocean, and energy balance to derive a better understanding of the planet’s climate and climate change, along with the impact of human actions on these processes. Once established in its Sun-synchronous polar orbit approximately 705 kilometers above Earth’s surface, Terra began collecting data in early 2000. Five instruments provided by NASA and international partners are aboard the spacecraft:
- Advanced Spaceborne Thermal Emission and Reflection Radiometer (ASTER)
- Clouds and the Earth’s Radiant Energy System (CERES)
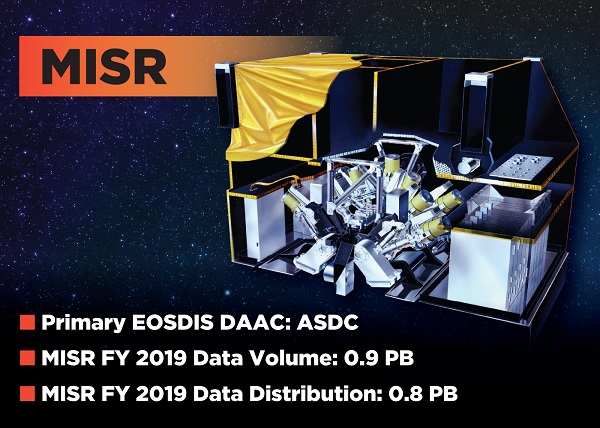
- Multi-angle Imaging SpectroRadiometer (MISR)
- Moderate Resolution Imaging Spectroradiometer (MODIS)
- Measurement of Pollution in the Troposphere (MOPITT)
All instruments continue to provide data that are processed into a wide range of standard data products for use in scientific research as well as near real-time (NRT) data for use in monitoring and managing on-going events such as storms, wildfires, and volcanic eruptions (a detailed description of Terra’s data processing system and strategy is available in the Earthdata article Terra: The Hardest Working Satellite in Earth Orbit).
According to figures from the ESDIS Metrics System (EMS), approximately 6.2 petabytes (PB) of Terra data were in the EOSDIS collection at the end of 2019, making up roughly 18.2 percent of the approximately 34 PB EOSDIS data collection. During the 2019 Fiscal Year (FY), which runs from October 1, 2018, to September 30, 2019, 12.65 PB of Terra data were distributed. Since 2000, the year the first Terra data were publicly available, approximately 50 PB of Terra data have been distributed to global data users. Distribution of data from Terra’s MODIS instrument remains the highest of any instrument data in the EOSDIS collection, and 10 PB of MODIS data were distributed during FY 2019. Terra instrument data are available through several discipline-specific EOSDIS Distributed Active Archive Centers (DAACs).
These numbers, however, represent only part of the Terra story. The data record compiled by Terra’s individual instruments, and how these instruments are used together, provides a better picture of the true monumental accomplishments of this mission over two decades orbiting our planet.
ASTER: Terra’s high-resolution imager
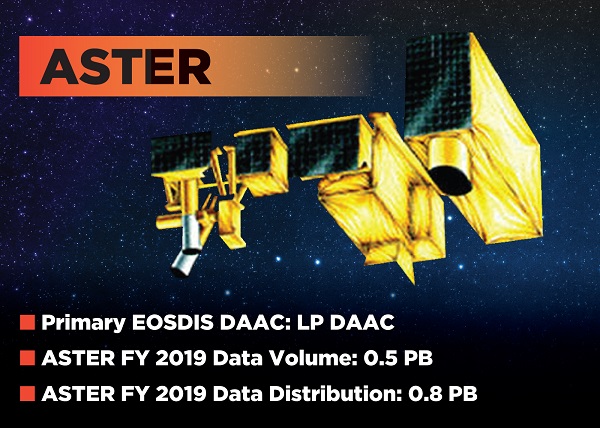
ASTER is a partnership between NASA and Japan’s Ministry of Economy, Trade and Industry (METI), and, notes ASTER U.S. Science Team Leader Michael Abrams, represents one of the longest-running—if not the longest-running—partnerships between NASA and another country’s space agency.
ASTER is the “zoom lens” of Terra, and has the highest spatial resolution of the five instruments. It also is pointable, which means it can view targets outside of its imaging swath and can be tasked to capture images of specific areas and events as well as produce global land maps. As Abrams notes, it often is used in conjunction with other instruments. “In MODIS data, you might have a pixel showing a vacant field with a little bit of vegetation; you don’t know what is causing the MODIS signal,” he says. “You go to a high-resolution instrument like ASTER to more closely examine the MODIS pixel to determine, say, that 80 percent of the area shown is fallow field or 10 percent is remnant forest and the other 10 percent might have some winter crop. ASTER gives you more information.”
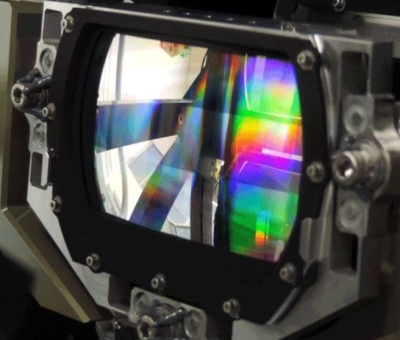
ASTER comprises three infrared-sensing telescopes: a visible near infrared (VNIR), a shortwave infrared (SWIR), and a thermal infrared (TIR), all three of which are pointable. One component of Terra’s SWIR telescope failed after nine years in operation. While the overall SWIR system is still recording data and sending signals back, the data are not usable; the Japanese manufacturer wants to keep the system running to do lifetime tests on the components.

An additional feature of ASTER’s VNIR telescope is a backward-looking telescope to complement the downward looking (nadir) telescope. Combining the high-resolution data from the two VNIR telescopes allows the ASTER team to produce stereoscopic images and detailed terrain height models. These data were used to produce one of the most significant ASTER accomplishments: the ASTER Global Digital Elevation Model, or GDEM. “We have a stereo camera, so you can calculate vertical relief,” Abrams says. “In 2009 we decided we had enough scenes in our archive to cover just about all of Earth’s surface and produced a global digital topography map with 30-meter spatial resolution covering all the land surface of Earth divided into one-degree-by-one-degree tiles.”
The third version of the ASTER GDEM was released in 2019. “There are about 22,000 tiles that cover the entire Earth, and Japan distributes the same product,” says Abrams. “Between LP DAAC and Japan, we’ve distributed around 83 million tiles.”
The ASTER GDEM, along with Level 1 and Level 2 ASTER data products, are available through NASA’s Land Processes DAAC (LP DAAC). If ASTER data are not available for an area of interest, users can submit a Data Acquisition Request (DAR) to the ASTER team using the ASTER DAR Tool.
Along with the ASTER GDEM, Abrams notes that ASTER data are components of several other projects. These include the Global Land Ice Monitoring from Space (GLIMS) project run by the National Snow and Ice Data Center (NSIDC) that uses ASTER DEMs to examine changes in glacier thickness and volume; the ASTER Volcano Archive, which covers about 1,500 active volcanoes and includes every ASTER scene showing these volcanoes; and the Global Emissivity Database (GED) that was created by a team at NASA’s Jet Propulsion Laboratory (JPL) from ASTER thermal observations.
As Abrams observes, the 30-year ASTER collaboration between NASA and Japan continues to work well, and a new seven-year extension of the agreement was signed in October 2019. “This has been one of the most interesting parts of my involvement with this whole mission—getting to work with people from another culture for a common goal and learning together how we can approach problems through our two cultures,” he says. “So far, we’ve been able to solve all our problems, so we must be doing something right.”
CERES: Observing Earth’s radiation budget
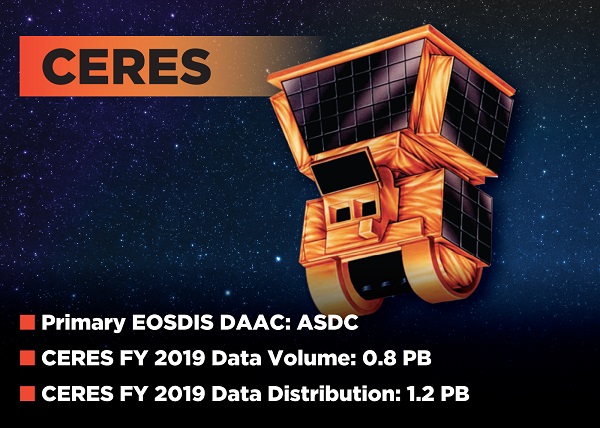
CERES measures reflected solar and emitted thermal infrared radiation from Earth. These data provide a better understanding of what drives Earth’s climate system and how it is changing. “The energy exchange between Earth and space is fundamental to climate,” explains Dr. Norman Loeb, the CERES PI. “It’s a record you need to have for a long, long time.”
The two CERES instruments aboard Terra continue a data record that began in 1997 with the launch of the first CERES instrument aboard the joint NASA/Japan Aerospace Exploration Agency Tropical Rainfall Measuring Mission (TRMM; operational 1997 to 2015). Six CERES instruments are currently in space. Along with the two CERES aboard Terra, two CERES instruments are aboard NASA’s Aqua satellite (operational 2002 to present) and a single CERES instrument is aboard the joint NASA/NOAA Suomi National Polar-orbiting Partnership (Suomi NPP; operational 2011 to present) and NOAA-20 (operational 2017 to present) satellites.

CERES data are available through NASA’s Atmospheric Science Data Center (ASDC), which archives and distributes EOSDIS data related to Earth’s radiation budget, clouds, aerosols, and tropospheric composition. Algorithm work is done by the CERES science team, which delivers approved algorithms to ASDC for data product generation. CERES data can be subset, visualized, and ordered using the CERES Browse and Subset ordering tool, which was co-developed by the CERES science team and ASDC.
Dr. Loeb notes that the two Terra instruments with the most synergy with CERES are MISR and MODIS. MODIS and MISR retrievals of cloud, aerosol, and surface properties provide climate researchers with unique data to probe what drives variations in Earth’s radiation budget observed by CERES over a range of time and space scales. The CERES team uses the multi-angle capability of MISR to verify some of the algorithms they developed, and MODIS data are used to infer atmospheric and surface properties. “Within a CERES footprint, the higher spatial resolution of MODIS gives context to the CERES measurement,” says Dr. Loeb. “The MODIS data are also used as input to a radiative transfer model that calculates radiative fluxes at the surface and within the atmosphere.”
The strength of the CERES data record is clearly seen when CERES data are fused with data from other instruments aboard both polar-orbiting and geostationary satellites. The CERES team used these data to create a fully-resolved global diurnal cycle of Earth’s radiation budget at the surface, multiple levels in the atmosphere, and at the top-of-atmosphere. “Doing this data fusion at the level at which we’re able to do it, fusing data from instruments aboard so many different satellites to produce a seamless climate data record, is one of the major accomplishments of the CERES team and ASDC,” Dr. Loeb says. “If you bring multiple instruments with complementary capabilities together in a self-consistent manner, you end up with a far more complete picture of Earth’s radiation budget than what is achievable with just a single instrument.”
Dr. Loeb observes that with CERES flying aboard so many Earth observing satellites with long data records like Terra (20+ years), Aqua (17+ years), and Suomi NPP (8+ years), systematic trends in the data are beginning to appear. “When you show people an intriguing yet subtle change in Earth’s radiation budget from the Terra [CERES] data, and then show that Aqua, Suomi NPP, and NOAA-20 are all seeing the same thing, it makes a very compelling case that the observed change is real and the CERES instruments on these different platforms are performing exceptionally well,” he says. “This lends a lot more confidence going forward when we won’t have the luxury of so many CERES instruments operating simultaneously. Having all of these measurements, having them all together, and having these beautiful long records has been really, really useful for science.”
MISR: Multi-angle studies of Earth’s atmosphere and surface
“There had never been an instrument like MISR flown before Terra,” says MISR PI Dr. David J. Diner. “Even now, there are no other instruments similar to MISR in orbit.”
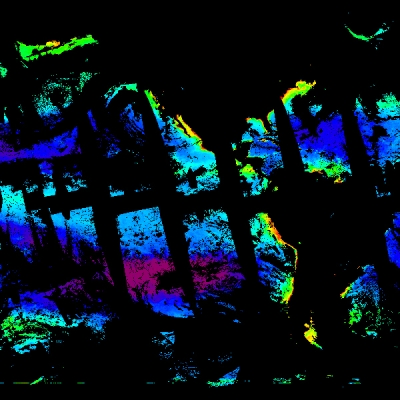
MISR uses nine cameras to capture multi-angular images of reflected sunlight scattered by Earth’s surface, clouds, and suspended airborne particles, called aerosols. MISR provides sensitivity to aerosol abundance and type, which is important for climate studies because the particles come in different sizes, shapes, and compositions, and, depending on their properties, can counteract or enhance warming due to greenhouse gases.
When the MISR proposal was submitted to NASA’s EOS in 1988, a main objective was to use this multi-angular dimension primarily for acquiring data about the effect of aerosols and clouds on the solar radiation budget and to study the angular reflection of light from vegetation to provide information about how plants interact with their environment.
 to red at the top (high aerosol concentrations).")
Dr. Diner notes that looking at the atmosphere from oblique angles accentuates the reflection of sunlight from aerosols relative to the surface. It also enhances the information content of these measurements. “At the start of the EOS era, we knew pretty well how to retrieve aerosol amounts over deep ocean because the surface is very dark and most of the scattered light is from the atmosphere,” he explains. “This is not the case over land. You have aerosols over deserts and urban areas that are bright. The challenge is how to separate out how much of the light is coming from the atmosphere. This has been a main thrust of research by the MISR science team and other EOS instrument investigators over the last two decades. It’s now routine to use satellites for retrieving aerosol concentrations over land.”
While Dr. Diner estimates that about two-thirds of published peer-reviewed papers using MISR data relate to atmospheric aerosols, he notes that in recent years there has been roughly a 50-50 split between using MISR aerosol data for climate and air pollution studies. In fact, linking near-surface particulate matter to air quality and human health is now one of the principal applications of MISR data.
Since launch, the science team has shown that MISR data are useful for many other applications than were anticipated in the original proposal. Besides sensitivity of MISR’s multi-angular observations to vegetation canopy structure, the data also are able to characterize ice sheet and sea ice surface roughness, which is an indicator of seasonal ice conditions. Furthermore, as the MISR instrument passes over an area, its cameras continuously collect images from nine different angles over a period of seven minutes. The result is imagery depicting clouds or aerosol plumes from different times as well as at different angles.
These temporal and stereoscopic elements provide the ability to use imagery from multiple cameras to depict the heights of aerosol plumes and cloud tops, along with their speed and direction of motion. This information is valuable for studying climate and environmental impacts. MISR-observed winds have also proven useful for improving the accuracy of weather forecasts. “What MISR has shown us is the tremendous power of multi-angle imagery,” Dr. Diner observes.
MISR is also used together with the other Terra instruments. The fusion of MISR and MODIS aerosol products with an atmospheric model has led to the generation of maps of near-surface particulate matter concentrations that have been used in numerous health studies such as the Global Burden of Disease, which estimates that more than four million premature deaths occur each year due to exposure to airborne particles.
While CERES also has a multi-angular capability, its spatial resolution is much coarser than MISR’s. This enables cross-comparison and validation of MISR and CERES data on the solar radiation budget. MISR and MOPITT have been used together to help map pollution from aerosols and carbon monoxide to track sources of air pollution. Finally, higher-resolution ASTER data have been used to improve MISR estimates of cloud fraction and to validate MISR stereoscopic results.
“The fact that we have a 20-year record only enhances the uniqueness of Terra data because now we can look at how things are changing over the long term,” says Dr. Diner. “There are a host of applications of MISR data. They may only be limited by our imaginations.”
MODIS: Creating multi-disciplinary, broad-scale images of Earth
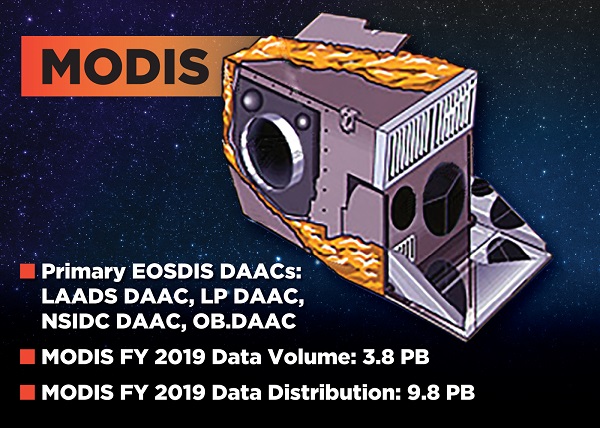
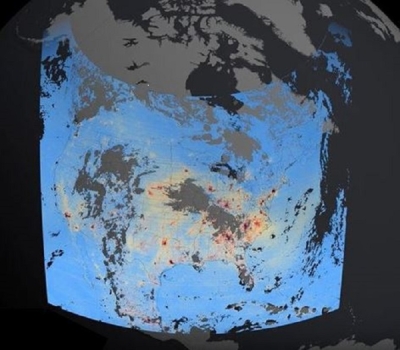
When you open the NASA Worldview data visualization application, the default base map you see is the current daily true-color image of Earth acquired by MODIS. By its sheer breadth of applications along with its ability to image almost every place on Earth every day, MODIS is the most heavily-used sensor aboard Terra based on the volume of data distributed, and continually collects data in 36 spectral channels in 2,330 km by 10 km swaths.
As noted by Dr. Michael King, the MODIS Science Team Leader, MODIS data are being used in studies across numerous disciplines. “It’s used to look at vegetative health, changes in land cover and land use, oceans and ocean biology, sea surface temperature, and cloud studies,” he says. “It provides information about cloud properties that no previous instrument has been able to do. It also is used extensively for monitoring fires and natural hazards along with oil spills and all kinds of things.”
As a result of its multi-disciplinary use, MODIS data are archived at and distributed through multiple discipline-specific EOSDIS DAACs. After being downloaded, raw MODIS data are sent to NASA’s Goddard Space Flight Center in Greenbelt, Maryland, for processing by Science Investigator-led Processing Systems (SIPS). Processed MODIS land products are sent to the USGS Center for Earth Resources Observation and Science (EROS) in Sioux Falls, SD. NASA’s Land Processes DAAC (LP DAAC) is co-located at EROS and archives and distributes MODIS land products. MODIS atmosphere products are processed and analyzed at Goddard, stored on NASA’s MODIS Adaptive Processing System (MODAPS), and distributed through NASA’s Level-1 and Atmosphere Archive and Distribution System (LAADS DAAC).
 NASA Worldview base map image of the Eastern U.S. from December 25, 2019.")
MODIS ocean biology and ocean color data are processed at Goddard by the Ocean Color Processing Group and archived at and distributed through NASA’s Ocean Biology DAAC (OB.DAAC). Finally, MODIS snow and ice data products are sent to NASA’s National Snow and Ice Data Center (NSIDC) DAAC. “The data and data processing have evolved greatly over 20 years,” Dr. King says. “Today, it’s a very automated and efficient process.”
Like his colleagues, Dr. King notes how MODIS data and capabilities complement those of other Terra instruments. “The MODIS cloud mask and clear sky data are used regularly in combination with MOPITT data for carbon monoxide monitoring and for knowing if MOPITT data are being collected through clouds or clear sky,” he says. “CERES data are used with MODIS data all the time. They use the aerosol optical product from MODIS and they use a lot of the MODIS spectral bands to identify the scene and determine cloud coverage or if the scene includes water clouds or ice clouds.”
MISR has similar capabilities as MODIS, and the two instruments are well-suited for use in aerosol monitoring as well as in studies of Polar winds. While ASTER imagery is acquired at a higher resolution than MODIS imagery, the ASTER instrument does not continually collect data like MODIS. This means that MODIS can be used to find targets for ASTER. This is especially useful when using MODIS thermal anomaly data to pinpoint the location of heat sources that could be wildfires or volcanic eruptions. ASTER can then be targeted to capture higher-resolution imagery of the MODIS-detected heat source.
Another important use of MODIS data is their adaptation into low-latency, real-time and near real-time data. “There’s direct broadcast, with stations around the world that can download raw MODIS data in very much real-time directly from the satellite,” says Dr. King. “Separate from this is NASA’s Land, Atmosphere Near Real-time Capability for EOS, or LANCE, which is able to provide several MODIS products generally within three hours of observation.” While these products do not have the extensive processing required for use in scientific research, their rapid availability make them valuable tools for monitoring on-going events like wildfires, volcanic eruptions, ice concentrations, and air quality.
For Dr. King, the significance of the MODIS data record is quite clear. “Because we have 20 years of MODIS data, you can see the evolution of change over a long time,” he observes. “It’s quite powerful to see these data over 20 years.”
MOPITT: Measuring carbon monoxide in lower levels of the atmosphere
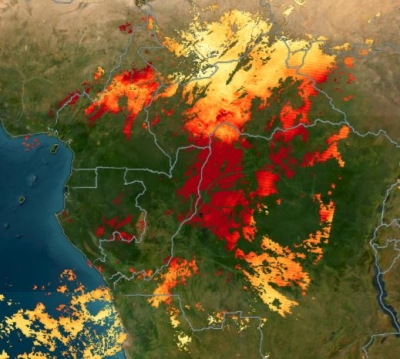
It’s not enough to know that microscopic suspended particles in the atmosphere are present, you also need to know the source of these particles. For example, if you know aerosols are coming from biomass burning, you can expect them to be in the form of organic carbon and black carbon. Powerplants, on the other hand, emit a lot of sulfur dioxide, but not much carbon monoxide. Terra’s MOPITT instrument helps determine the sources of aerosols, along with other information about atmospheric composition.
MOPITT is a joint venture of NASA and the Canadian Space Agency. As noted by Dr. Helen Worden, the MOPITT U.S. PI, MOPITT is the only Terra instrument focused on trace gas pollution, specifically carbon monoxide. Comparing MOPITT data with data from MODIS and MISR, both of which measure aerosol optical depth, provides more information on the sources of atmospheric aerosols. “We were the first continuous global observations of carbon monoxide,” says Dr. Worden. “This showed how pollution from large urban and biomass burning sources, like fires in the Amazon, is transported globally. People take this for granted now, but this wasn’t the case until you had the satellite view of carbon monoxide transport.”

Carbon monoxide in the atmosphere is unique in that it’s much shorter-lived in the atmosphere than gasses like methane and carbon dioxide. As Dr. Worden notes, carbon monoxide plumes can travel around the world and still be easily tracked since it is possible to detect the enhancements caused by large sources. “With methane it’s harder to see this because it stays in the atmosphere around 11 years and the background levels are higher from all the methane that’s accumulated,” Dr. Worden explains. “And carbon dioxide stays in the atmosphere even longer, so satellite instruments need higher precision to see an enhancement [of carbon dioxide] against the background in the atmosphere.”
The MOPITT instrument was constructed by a consortium of Canadian companies and funded by the Space Science Division of the Canadian Space Agency. MOPITT instrument operations and data processing are divided between U.S. and Canadian teams. “The Canadian MOPITT team does all the instrument commanding and engineering,” says Dr. Worden. “The U.S. team works with NASA’s ASDC to do all the data processing, with algorithm updates and data validation done at the National Center for Atmospheric Research (NCAR) in Boulder, Colorado.”
In a practical use of MOPITT data, Dr. Worden describes a study on which she worked looking at changes in carbon monoxide during the 2008 Summer Olympics in Beijing, China. The Chinese government significantly limited traffic during the Olympics. The result was a dramatic reduction in carbon monoxide emissions from automobiles and trucks. “You can see the effects of pollution reduction from space using MOPITT and use these data to make projections about the transportation sector and impacts on both carbon monoxide and carbon dioxide emissions,” she says.
MOPITT is currently the longest running record of carbon monoxide concentrations collected from space. “This is a great success story,” says Dr. Worden. “In addition to understanding decadal scale trends in carbon monoxide, when a new satellite instrument measuring carbon monoxide goes up, they have a reliable record against which they can compare to verify that their instrument is performing properly and collecting reasonable data.”
Five instruments; one data record
When Terra was launched more than 20 years ago it was expected to be the first of three satellites designed to compile a 15-year record of Earth processes. The single Terra data record now stretches beyond 20 years. All five instruments have performed far beyond their design expectations, and continue, with few minor issues, to provide a steady stream of data that form the foundation of a monumental climate data record.
The value of these data is evident in the amount of peer-reviewed research conducted using Terra data, such as the 15,185 unique peer-reviewed publications based on MODIS data (with 1,867 articles published in 2019, according to MODIS science team metrics); the 479 peer-reviewed publications based on MOPITT data as of January 22, 2020; or the more than 1,820 peer-reviewed CERES-based publications. As Terra data continue to be added to NASA’s EOSDIS collection, so does the research conducted using these data—research that furthers our understanding of Earth’s vast array of interconnected processes.
From five instruments, one data record. From the many, one. E pluribus, unum.
E pluribus … Terra.
Read more about 20 years of Terra