This data pathfinder links to NASA datasets/tools that can aid with decisions regarding the environmental impacts of changes in human behavior from COVID-19.
Image
Colorized scanning electron micrograph of a VERO E6 cell (blue) heavily infected with SARS-COV-2 virus particles (orange). Image courtesy of the National Institute of Allergy and Infectious Diseases Integrated Research Facility in Fort Detrick, Maryland. Credit: NIAID.
In January 2020, the World Health Organization began investigating a cluster of medical cases caused by a new strain of the severe acute respiratory syndrome (SARS) coronavirus, SARS-CoV-2. SARS-CoV-2 causes the disease COVID-19, which has spread rapidly throughout the world. Scientists know very little about it.
Researchers across the globe are studying the novel virus to discover the key forces in the virus’ spread. In addition, remote sensing scientists are looking at the potential changes in the environment due to the change in human behavior—quarantine and stay-at-home measures.
Satellites cannot detect the spread of the disease from space, but they can measure changes in Earth’s environment due to changes in human behavior. NASA and other federal agencies use satellite and airborne data to assess regional and global environmental, economic, and societal impacts of the COVID-19 pandemic. (See the Rapid Response and Novel Research in Earth Science funding solicitation.)
In addition, because of long-term data collection, historical remote sensing data provide more spatially and temporally complete data records, such as measurements of precipitation, temperature, and humidity, which provide baselines for historical comparisons, when looking at potential seasonality trends.
This data pathfinder provides links to datasets that can be used to research changing environmental impacts from modified human behavior patterns, the possibility of seasonal trends in virus transmission, and water availability.The tri-agency COVID-19 Dashboard is a concerted effort between the European Space Agency (ESA), the Japan Aerospace Exploration Agency (JAXA), and NASA. The dashboard combines the resources, technical knowledge and expertise of the three partner agencies to strengthen our global understanding of the environmental and economic effects of the COVID-19 pandemic.
The Diseases Data Pathfinder provides information about environmental variables and links to NASA data and data analysis tools that can aid in our general understanding of disease.
New to using NASA Earth science data? This pathfinder is designed to help guide you through the process of selecting and using applicable datasets, with guidance on resolutions and direct links to the data sources.
After getting started here, there are numerous NASA resources that can help develop your skills further. If you are new to remote sensing, check out What is Remote Sensing? or view NASA's Applied Remote Sensing Training on Fundamentals of Remote Sensing.
Please visit the Earthdata Forum, where you can interact with other users and NASA subject matter experts on a variety of Earth science research and applications topics.
About the Data
NASA collaborates with other federal entities and international space organizations, including NOAA, USGS, JAXA, and ESA, to provide information for understanding a number of phenomena related to COVID-19.
NASA’s Earth science data products are validated, meaning their accuracy has been assessed and verified over a widely distributed set of locations and time periods via several ground-truth and validation efforts. These data are freely and openly available to all users.
Datasets referenced in this pathfinder are from sensors shown in the table below. Some of these datasets are available through NASA’s Land, Atmosphere Near real-time Capability for EO (LANCE). LANCE provides data to the public within 3 hours of satellite overpass, which allows for near real-time (NRT) monitoring and decision making. If latency is not a primary concern, users are encouraged to use the standard science products, which are produced using the best available calibration, ancillary, and ephemeris information.
In collaboration with the Amazon Web Service Public Dataset Program, NASA has made some of the datasets available in Cloud Optimized GeoTIFF (COG) format. These datasets are noted with "COG" in the table below.
Precipitation Rate: imagery resolution is 2 km, sensor resolution is 5 km
Precipitation rate: daily
Precipitation
Integrated multi-satellite data
Tropical Rainfall Measuring Mission (TRMM) Multi-satellite Precipitation Algorithm (TMPA)
Integrated Multi-satellite Retrievals for Global Precipitation Measurement (GPM) (IMERG)
0.1° x 0.1° or 0.25° x 0.25°
half-hourly, daily, monthly
Precipitation
Soil Moisture Active Passive (SMAP)
Radar (active) - no longer functional
Microwave radiometer (passive)
9 km, 36 km
1 day
Soil Moisture, Sea Surface Salinity
Aqua
Atmospheric Infrared Sounder (AIRS) Level 2 and 3 products *
1° x 1°
daily, 8-day, monthly
Surface Air Temperature, Relative Humidity, Carbon Monoxide, Ozone
NASA/USGS Landsat 7
Enhanced Thematic Mapper (ETM)
15, 30, 60 m
16 days
Surface Reflectance
NASA/USGS Landsat 8
Operational Land Imager (OLI)
Thermal Infrared Sensor (TIRS)
15, 30, 60 m
16 days
Surface Reflectance
* sensors from which select datasets are available in LANCE
Note: this is not an exhaustive list but rather only includes datasets archived within NASA's Earth Observing System Data and Information System (EOSDIS)
In addition to mission data, NASA has a series of models that use satellite- and ground-based observational data to produce high-quality fields of land surface states and fluxes. The Land Data Assimilation System (LDAS) provides data in both a global collection (GLDAS) and a North American collection (NLDAS).
NASA's Modern-Era Retrospective analysis for Research and Applications version 2 (MERRA-2) is an atmospheric reanalysis that uses Goddard Earth Observing System Model, Version 5 (GEOS-5) data in its Atmospheric Data Assimilation System (ADAS). The MERRA project focuses on historical climate analyses for a broad range of weather and climate time scales and places the NASA suite of observations in a climate context.
Model Source
Data Parameter
Spatial Resolution
Temporal Resolution
Land Data Assimilation System (LDAS)
Land surface temperature, Soil moisture, Precipitation
GLDAS: 0.25°
FLDAS: 0.1°
NLDAS: 0.125°
Monthly, daily, hourly
Modern-Era Retrospective analysis for Research and Applications version 2 (MERRA-2)
Humidity, Precipitation Rate, Temperature, Land Surface Diagnostics, Winds, Soil Moisture
0.5° x 0.625°
Diurnal, Monthly
Use the Data
Image
Lighting changes can be seen between January 19 and February 4, 2020 in Jianghan District, a commercial area of Wuhan, and nearby residential areas. (Courtesy of NASA's Earth Observatory.)
Scientists, researchers, decision-makers, and others use remote sensing data in numerous ways. Satellite imagery, coupled with ground-based data, aids in our understanding of many natural phenomena and human behaviors. Below are several use cases illustrating how NASA Earth science data are being used to understand COVID-19 and how changes in human behavior are having impacts on the environment.
When deciding to use remote sensing data, it is important to consider both the benefits and the limitations of the data.
Benefits of using satellite data include:
Larger spatial coverage over ground-based data: ground-based data are more comprehensive on a local scale, providing direct observations of phenomena. However, airborne or satellite data are far more extensive, with millions of measurements over regional and global scales, providing more complete spatial coverage.
Better temporal resolution: many ground-based studies often use data sampled at a single point in time. The temporal resolution of satellite data ranges from hours to weeks. Many satellites pass over the same spot on Earth every one-two days; some as seldom as every 16+ days. These data have been collected over increasingly long periods of time, from the 1970s to the present.
Monitoring in near-real time: some satellite information is available 3-5 hours after observation, allowing for a faster response than ground-based observations.
Limitations specific to using satellite data in ecological assessments:
Loss of fine spatial resolution: while lower resolution data provide a more global view, as with the Aqua/Terra Moderate Resolution Imaging Spectroradiometer (MODIS) measurements, the spatial resolution is too coarse for certain assessments. Most satellite-based data are not at a fine enough resolution to distinguish individual organisms and their movements; for example, using most satellite-based data, scientists can determine the presence/absence of an algal bloom, yet the particular species of algae cannot be determined. This is not the case for instruments with higher resolutions, like those on Landsat or present on airborne missions.
Spectral resolution: passive instruments (those that use the energy being reflected or emitted from Earth for measurements) are not able to penetrate cloud or vegetation cover, which can lead to data gaps or a decrease in data utility. This is not the case when using data from active instruments like microwave sensors.
It is not possible to combine all desirable features into one remote sensor: to acquire observations with high spatial resolution (like Landsat) a narrower swath is required, which in turn requires more time between observations of a given area, resulting in a lower temporal resolution. Researchers have to make trade-offs. Finding a sensor with the spatio-temporal resolution capable of addressing a given area of research, application, or decision making is a crucial first step to getting started with using remote sensing data.
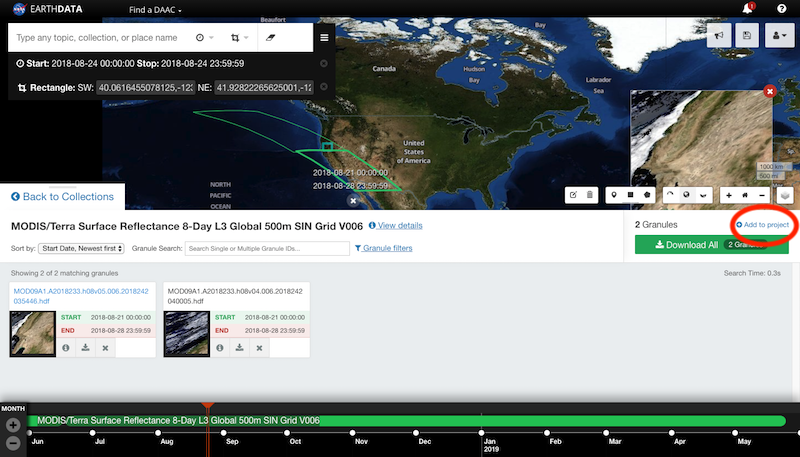
Earthdata Search is a tool for discovering and accessing Earth observation data collections from the EOSDIS collection as well as from U.S. and international agencies across Earth science disciplines.
Users (including those without specific knowledge of the data) can search for and read about data collections, search for data files by date and spatial area, preview browse images, and download or submit requests for data files (with customization for select data collections).
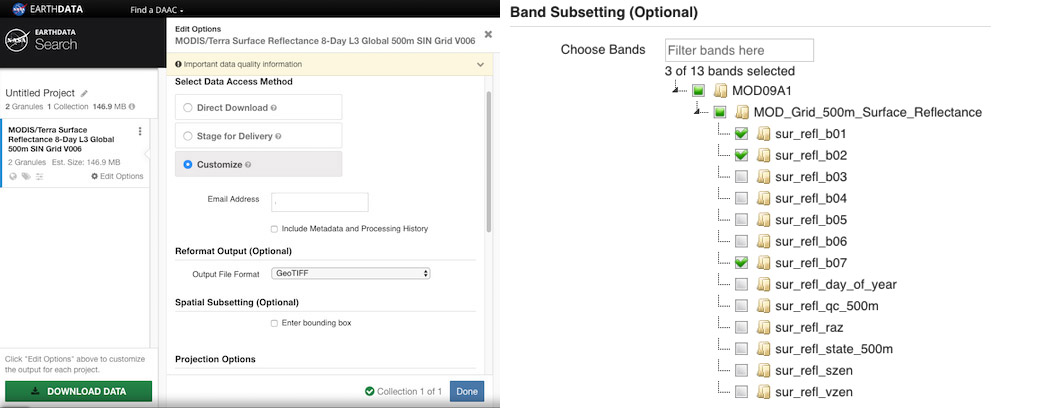
In the project area, for some datasets, you can customize your granule. You can reformat the data and output as HDF, NetCDF, ASCII, KML, or a GeoTIFF. You can also choose from a variety of projection options. Lastly, you can subset the data, obtaining only the bands that are needed.
Panoply
HDF and NetCDF files can be viewed using NASA's Panoply application that plots geo-referenced and other arrays. Panoply offers additional functionality, such as slicing and plotting arrays, combining arrays, and exporting plots and animations.
Panoply informational videos are available on NASA's YouTube channel:
Files in HDF and NetCDF format can be viewed using NASA's Panoply application that plots geo-referenced and other arrays. Panoply offers additional functionality, such as slicing and plotting arrays, combining arrays, and exporting plots and animations.
Panoply informational videos are available on NASA's YouTube channel:
Giovanni is a NASA online environment for displaying and analyzing geophysical parameters. There are many options for analysis. The following are the more popular ones:
Time-averaged maps are a simple way to observe the variability of data values over a region of interest.
Map animations can be used to observe spatial patterns and detect unusual events over time.
Area-averaged time series are a way to display the value of a data variable that has been averaged from all the data values acquired for a selected region for each time step.
Histogram plots display the distribution of values of a data variable in a selected region and time interval.
For more detailed tutorials:
Giovanni How-To's on NASA's Goddard Earth Sciences Data and Information Services Center (GES DISC) YouTube channel.
Data recipe for downloading a Giovanni map in NetCDF format and converting data to quantifiable map data in the form of latitude-longitude-data value ASCII text.
Worldview
The NASA Worldview visualization application provides the capability to interactively browse almost 1,000 global, full-resolution satellite imagery layers and then download the underlying data. Many of the available imagery layers are updated within three hours of observation, essentially showing Earth as it looks "right now." This supports time-critical application areas such as wildfire management, air quality measurements, and flood monitoring. Imagery in Worldview is provided by NASA's Global Imagery Browse Services (GIBS).
Worldview also includes nine geostationary imagery layers from the GOES-East, GOES-West, and Himawari-8 satellites that are available at 10-minute increments for the last 30 days. These layers include Red Visible, which can be used for analyzing daytime clouds, fog, insolation, and winds; Clean Infrared, which provides cloud top temperature and information about precipitation; and Air Mass RGB, which enables the differentiation between air mass types (e.g., dry air, moist air, etc.). These full-disk hemispheric views allow for almost real-time viewing of changes occurring around most of the world.
Image
Worldview Suomi NPP/VIIRS nighttime lights comparison image showing power outages caused by Hurricane Irma in September 2017. The right image (acquired 1 September 2017) shows the island before Hurricane Irma. The left image (acquired 9 September 2017) shows power outages across island after Hurricane Irma. NASA Worldview image.
AppEEARS
AppEEARS, from LP DAAC, offers a simple and efficient way to access and transform geospatial data from a variety of federal data archives. AppEEARS enables users to subset geospatial datasets using spatial, temporal, and band/layer parameters. Two types of sample requests are available: point samples for geographic coordinates and area samples for spatial areas via vector polygons. For help using AppEEARS, check out the LP DAAC AppEEARS E-Learning tutorials.
Performing Area Extractions
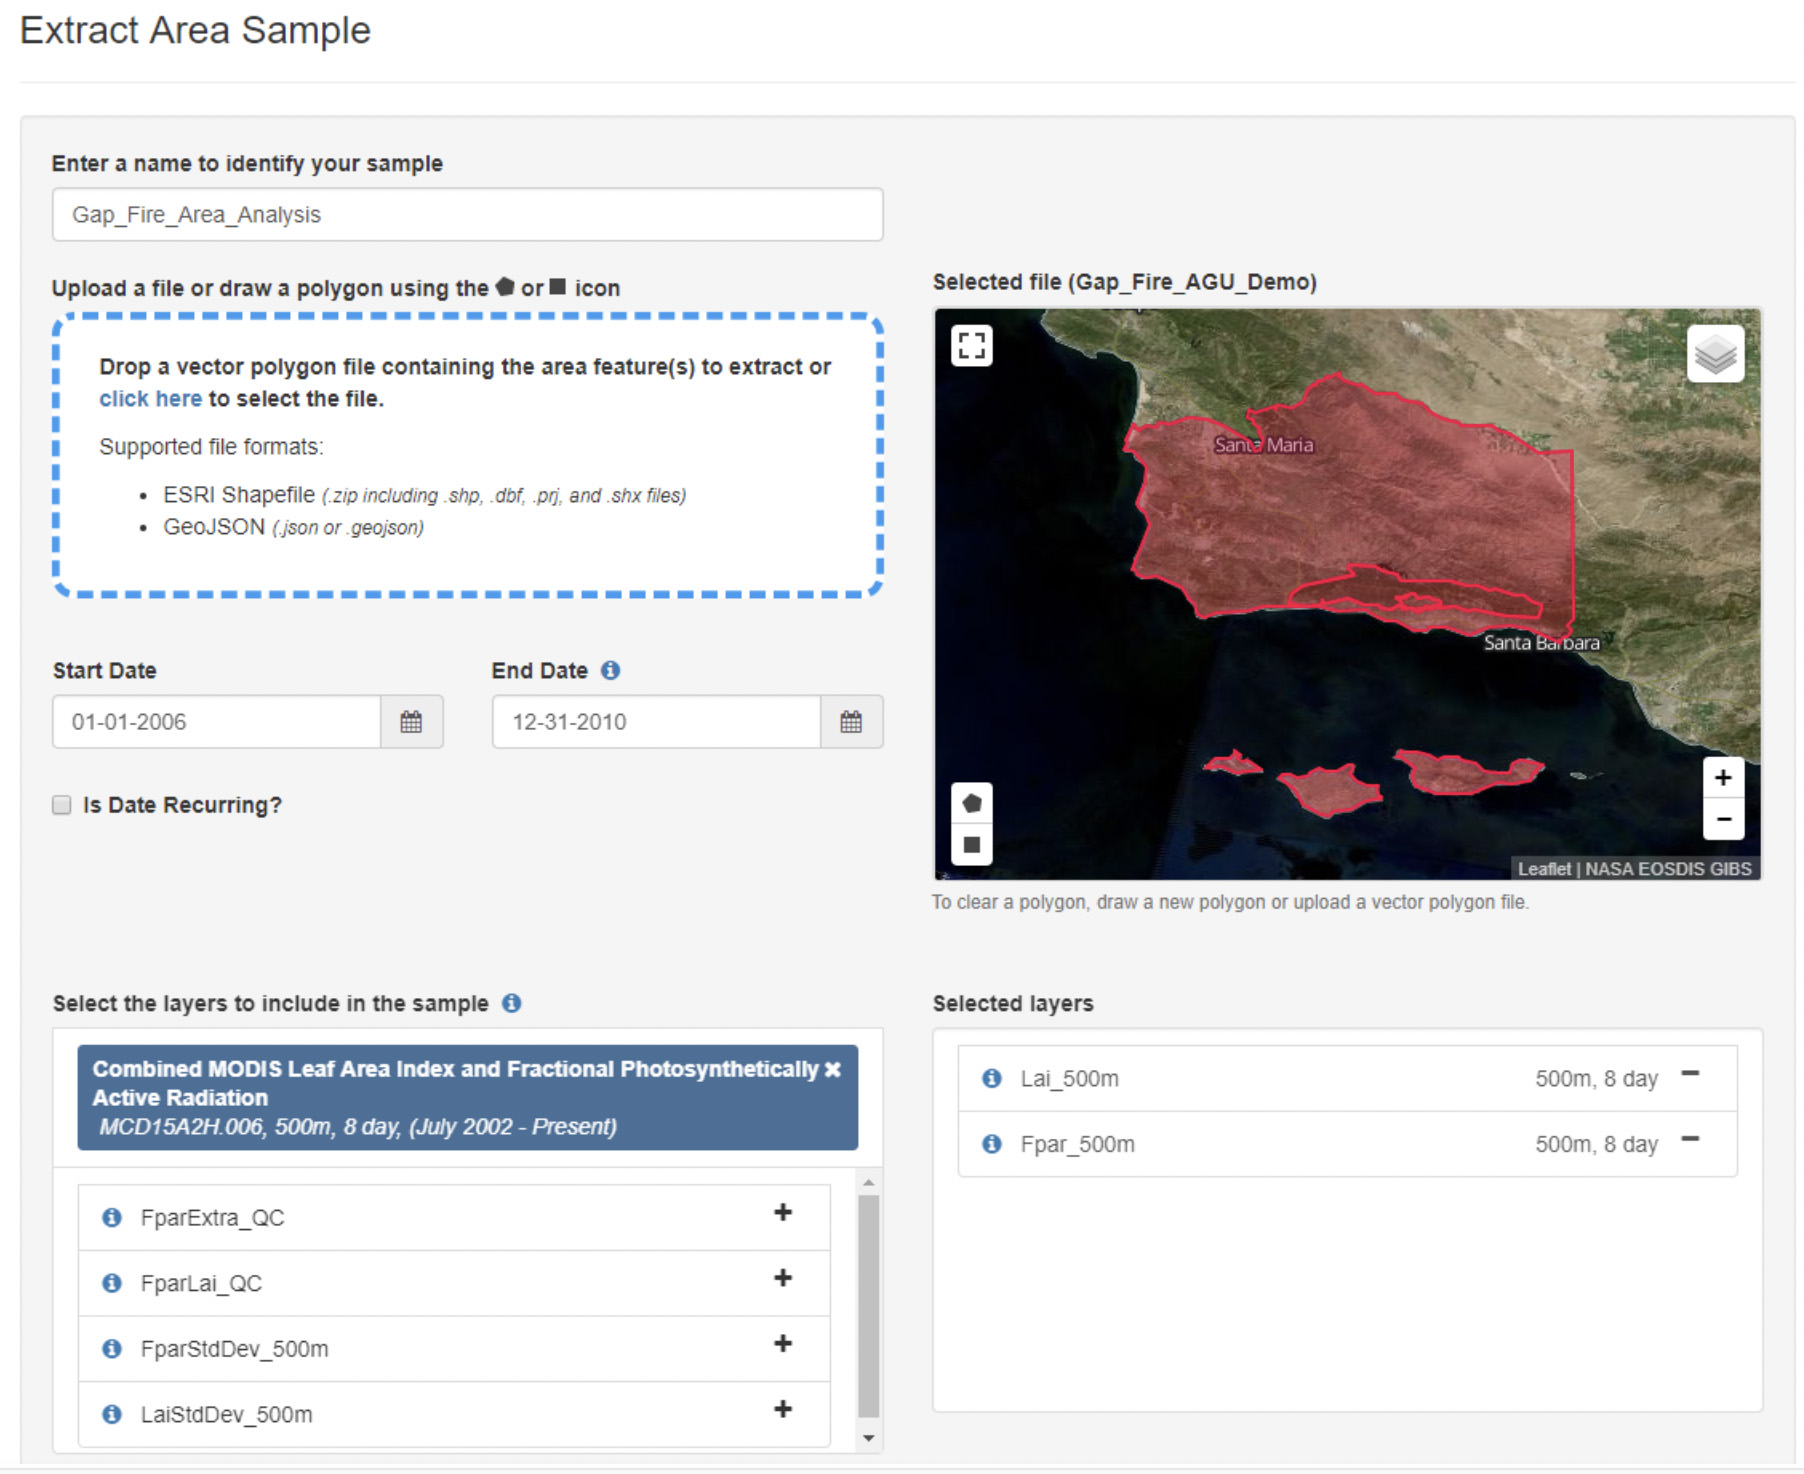
After choosing to request an area extraction, you will be taken to the Extract Area Sample page where you specify a series of parameters that are used to extract data for your area(s) of interest.
Spatial Subsetting
Define your region of interest in one of three ways:
Upload a vector polygon file in shapefile format (you can upload a single file with multiple features or multipart single features). Files in .shp, .shx, .dbf, or .prj format must be zipped into a file folder to upload.
Upload a vector polygon file in GeoJSON format (can upload a single file with multiple features or multipart single features).
Draw a polygon on the map by clicking on the bounding box or polygon icons (single feature only).
Select the date range for your time period of interest.
Specify the range of dates for which you wish to extract data by entering a start and end date (MM-DD-YYYY) or by clicking on the Calendar icon and selecting a start and end date in the calendar.
Adding Data Layers
Enter the product short name (e.g., MOD09A1, ECO3ETPTJPL), keywords from the product long name, a spatial resolution, a temporal extent, or a temporal resolution into the search bar. A list of available products matching your query will be generated. Select the layer(s) of interest to add to the selected layers list. Layers from multiple products can be added to a single request. Be sure to read the list of available products available through AppEEARS.
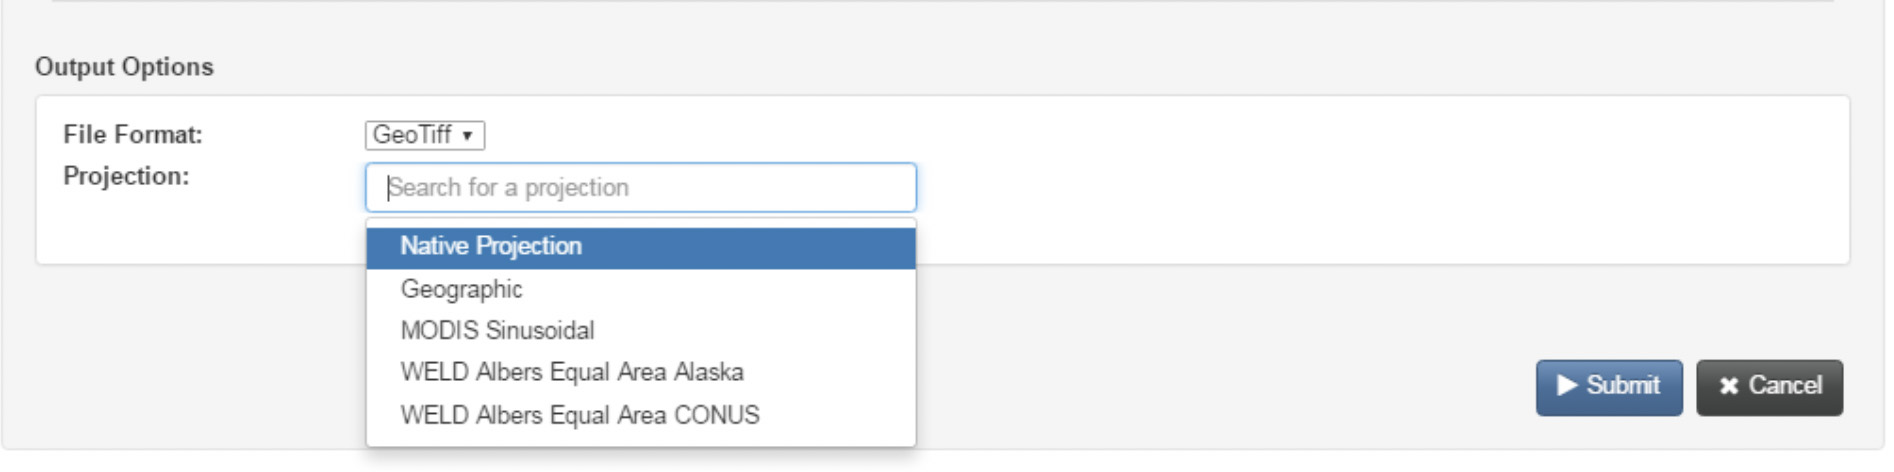
Selecting Output Options
Two output file formats are available:
GeoTIFF
NetCDF4
If GeoTIFF is selected, one GeoTIFF will be created for each feature in the input vector polygon file for each layer by observation. If NetCDF4 is selected, outputs will be grouped into files in .nc format by product and by feature.
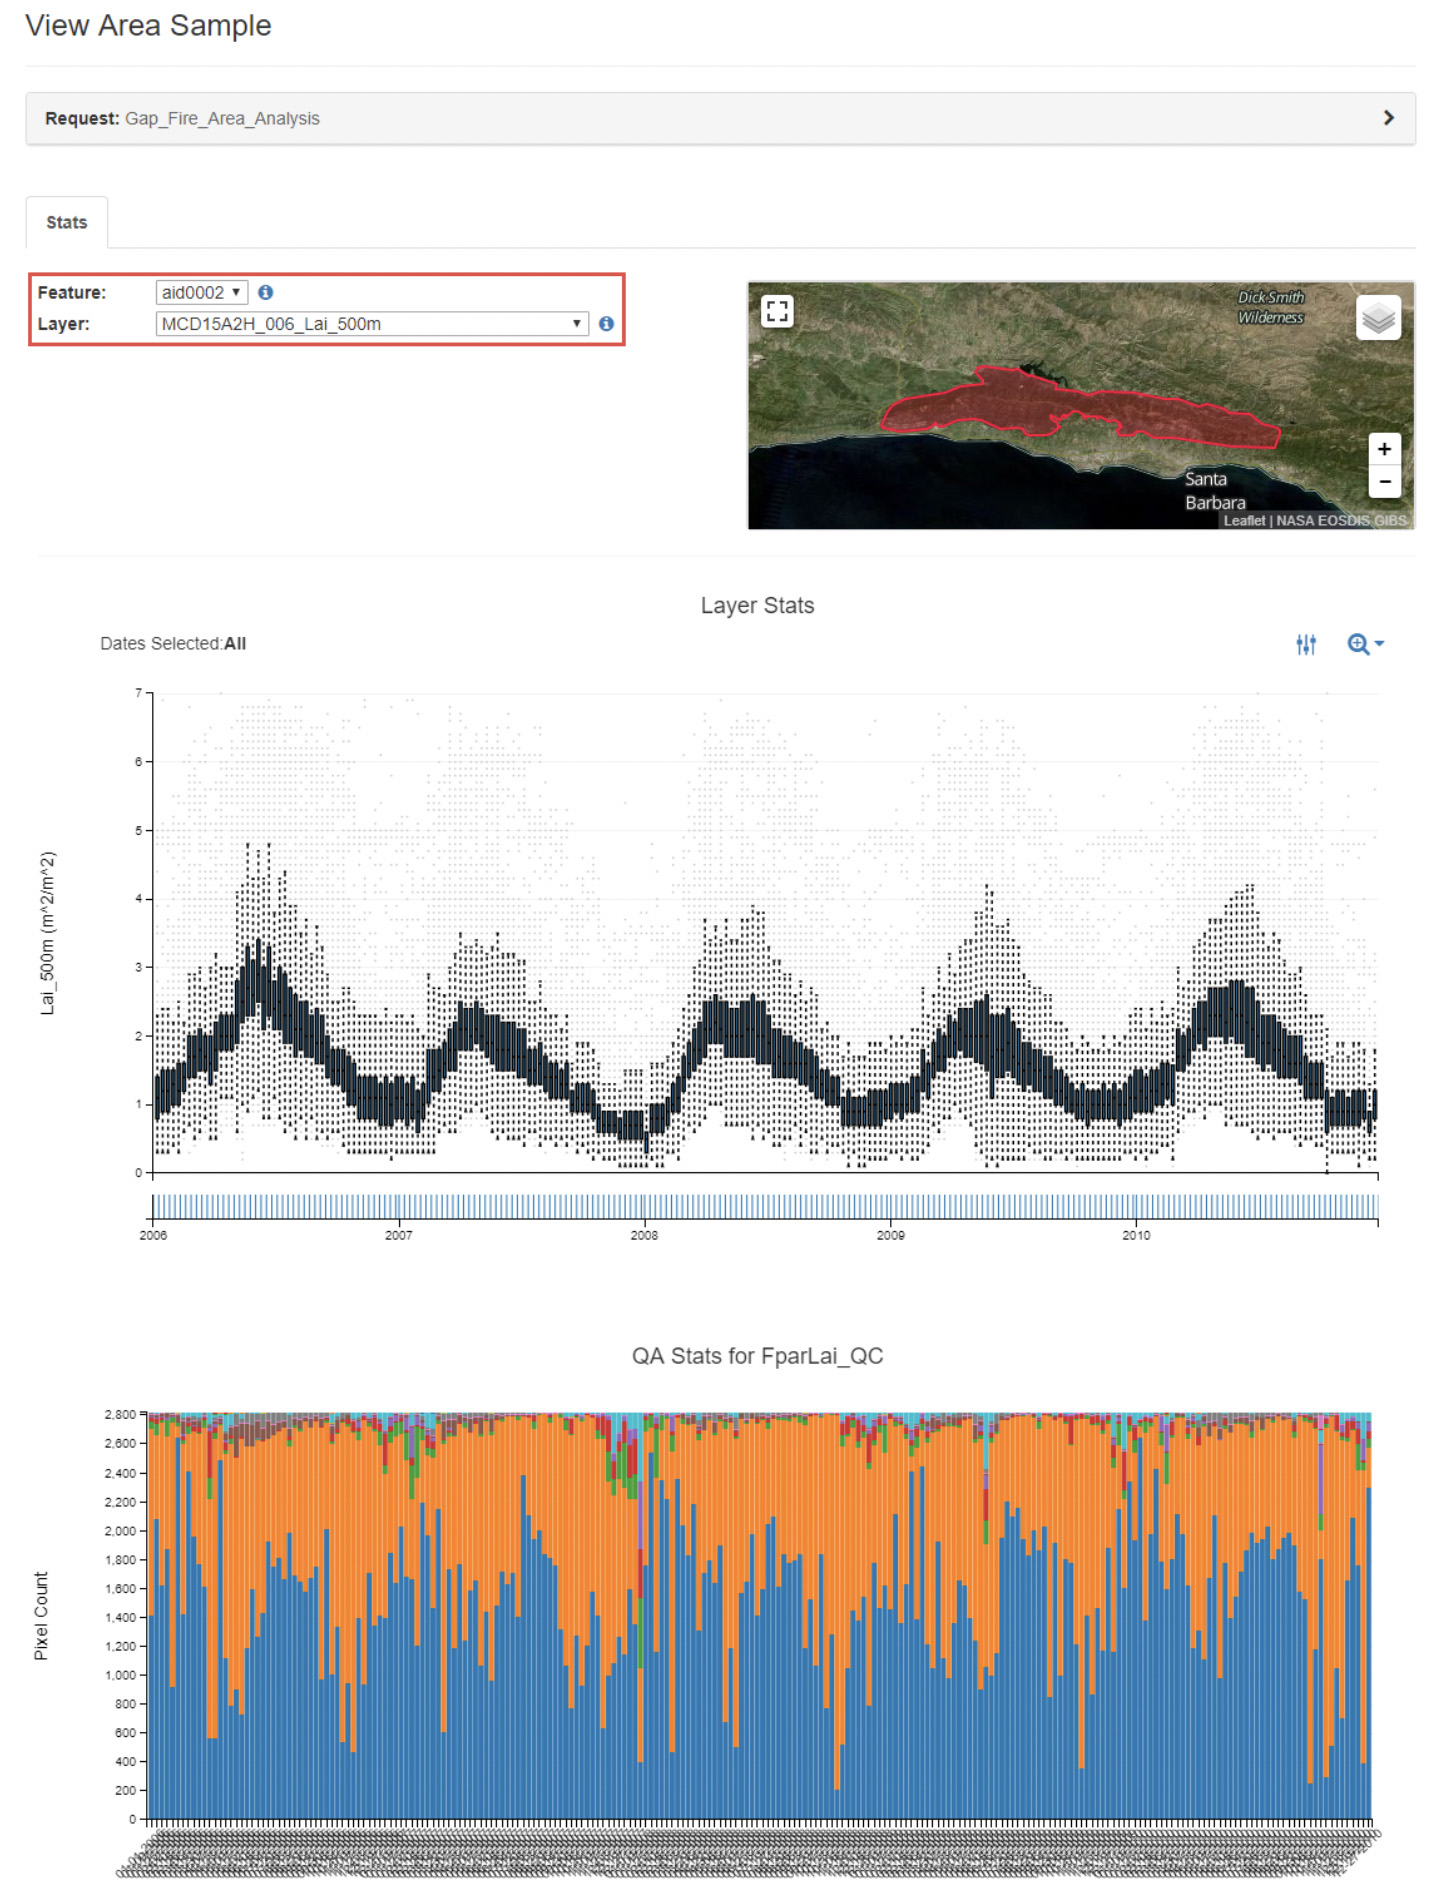
Interacting with Results
From the Explore Requests page, click the view icon to view and interact with your results. This will take you to the View Area Sample page.
The Layer Stats plot provides time series boxplots for all of the sample data for a given feature, data layer, and observation. Each input feature is renamed with a unique AppEEARS ID (AID). If your feature contains attribute table information, you can view the feature attribute table data by clicking on the information icon to the right of the feature dropdown. To view statistics from different features or layers, select a different aid from the feature dropdown and/or a different layer of interest from the layer dropdown.
Be sure to check out the AppEEARS documentation to learn more about downloading the output GeoTIFF or NetCDF4 files.
Soil Moisture Visualizer
NASA's Oak Ridge National Laboratory DAAC (ORNL DAAC) has developed a Soil Moisture Visualizer tool (read about it at Soil Moisture Data Sets Become Fertile Ground for Applications) that integrates a variety of different soil moisture datasets over North America. The visualization tool incorporates in-situ, airborne, and remote sensing data into one easy-to-use platform. This integration helps to validate and calibrate the data and provides spatial and temporal data continuity. It also facilitates exploratory analysis and data discovery for different groups of users. The Soil Moisture Visualizer offers the capability to geographically subset and download time series data in .csv format. For more information on the available datasets and use of the visualizer view the Soil Moisture Visualizer Guide.
To use the visualizer, select a dataset of interest under the data heading. Depending on the dataset chosen, the visualizer provides the included latitude/longitude or an actual site location name and relative time frame of data collection. Upon selecting the parameter, the tool displays a time series with available datasets. All measurements are volumetric soil moisture. Surface soil moisture is the daily average of measurements at 0-5 cm depth, and root zone soil moisture (RZSM) is the daily average of measurements at 0-100 cm depth. The tool also provides data sources for download.
Image
The Soil Moisture Visualizer allows users to compare soil moisture measurements from multiple sources (figure legends, top left and bottom right) at the same location. In this screenshot, Level 4 Root Zone Soil Moisture (L4 RZSM) data from NASA’s Soil Moisture Active Passive (SMAP) Observatory are shown with data from in situ sensors across the 9-kilometer Equal-Area Scalable Earth (EASE) grid cell encompassing the Tonzi Ranch Fluxnet site in the Sierra Nevada foothills of California. Daily precipitation values for the site (purple spikes) are also provided for reference.
With the Global Subset Tool, you can request a subset for any location on Earth, provided in GeoTiff and text format, including interactive time-series plots and more. Specify a site by entering the site's geographic coordinates and the area surrounding that site (from one pixel up to 201 x 201 km). From the available datasets, you can specify a date and then select from MODIS Sinusoidal Projection or Geographic Lat/Long. You will need to register for an Earthdata Login to request data.
With the Fixed Subsets Tool, you can download pre-processed subsets for more than 3,000 field and flux tower sites for validation of models and remote sensing products. The goal of the Fixed Sites Subsets Tool is to prepare summaries of selected data products for the community to characterize field sites. It includes sites from networks such as National Ecological Observatory Network, Forest Global Earth Observatory network, Phenology Camera network, and Long Term Ecological Research Network.
With the Web Service, you can retrieve subset data (in real-time) for any location(s), time period, and area programmatically using a REST web service. Web service client and libraries are available in multiple programming languages, allowing integration of subsets into a workflow.
Image
Top image: The Global Subsets Tool enables users to download available products for any location on Earth. Bottom image: The Fixed Sites Subsets Tool provides spatial subsets for established field sites for site characterization and validation of models and remote sensing products.
Spatial Data Access Tool (SDAT)
ORNL DAAC's SDAT is an Open Geospatial Consortium (OGC) standards-based web application to visualize and download spatial data in various user-selected spatial/temporal extents, file formats, and projections. Datasets including land cover, biophysical properties, elevation, and selected ORNL DAAC archived data are available through SDAT. Files in KMZ format are also provided for data visualization in Google Earth.
Within SDAT, select a dataset of interest. Upon selection, the map service will open displaying the various measurements with the associated granule and a visualization of the selected granule.
Image
Canopy Height, Kalimantan Forests, Indonesia, 2014 from the Oak Ridge National Laboratory Distributed Active Archive Center Spatial Data Access Tool.
You can then select your spatial extent, projection, and output format for downloading.
Image
Canopy Height, Kalimantan Forests, Indonesia, 2014 from the Oak Ridge National Laboratory Distributed Active Archive Center Spatial Data Access Tool with various output options.
SeaDAS
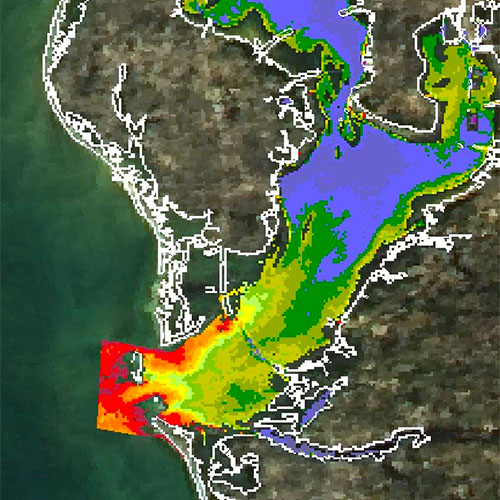
SeaDAS, available at OB.DAAC, is a comprehensive software package for the processing, display, analysis, and quality control of ocean color data. While the primary focus of SeaDAS is ocean color data, it is applicable to many satellite-based Earth science data analyses.
Image
SeaDAS is a comprehensive software package for the processing, display, analysis, and quality control of ocean color data. This image shows ocean color, sea surface temperature and non-algal material plus colored dissolved organic matter.
Image
SeaDAS processing components (OCSSW)
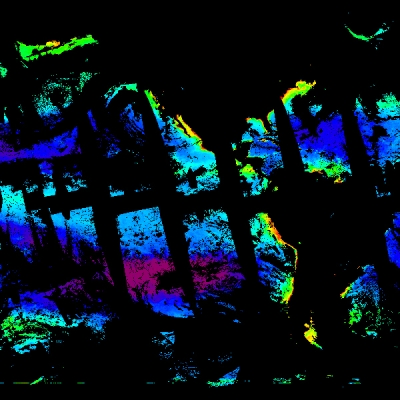
SeaDAS allows you to visualize data and re-project, crop, and create land, water, and coastline masks as well as perform mathematical and statistical operations, such as plotting histograms and creating scatter plots.
In-situ data can be incorporated as well; this is critical for data validation. To integrate in-situ data, the file must be tab-delimited with fields of data, time, station (with the stations defined in the file), latitude, longitude, and depth. Date needs to be defined as YYYYMMDD and time as HH:MM:SS.
Once the tab-delimited file is complete, you can select Vector/Import and then select your data source. Remember, in order to validate your remotely sensed data, you only want to look at the in-situ data at the surface (depth of 0).
Image
SeaDAS allows for the integration of in-situ data in order to validate satellite measurements.
For more detailed tutorials:
SeaDAS Video tutorials and demos
OB.DAAC recommends viewing the first few in the order they are shown. The core videos are listed first, followed by multi-tool case studies; everything below that appears in chronological order by release date.
SeaDAS FAQs
Frequently asked questions from SeaDAS users.
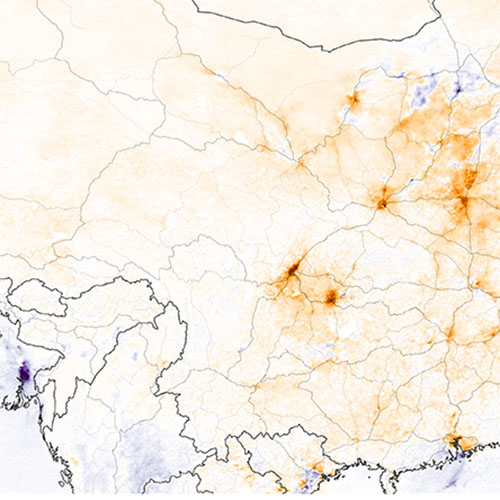
To counter the onset and rapid spread of COVID-19, quarantine and social distancing measures were implemented around the world. Due to this drastic alteration in human behavior, changes in the environment occurred.
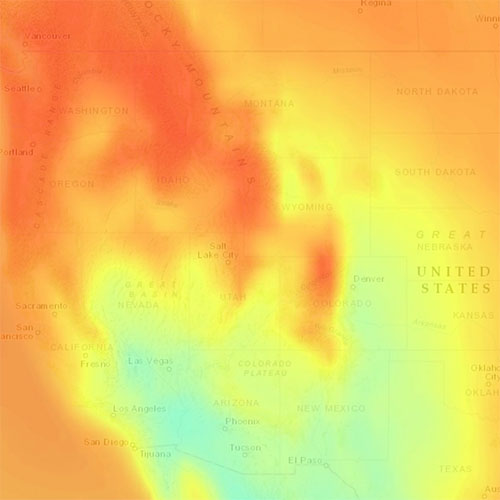
Seasonal flus are most commonly found in the fall and winter seasons when temperature and humidity are lower. The COVID-19 virus is novel. However, NASA temperature, humidity, and ultraviolet (UV) irradiance datasets may offer an opportunity to monitor this over time.
Many people lack adequate access to water and sanitation facilities and a changing climate could increase that number even more. Access to safe water, adequate sanitation, and proper hygiene is critical for a reduction in illness and death from diseases like COVID-19.
 heavily infected with SARS-COV-2 virus particles (orange), isolated from a patient sample. Image captured and color-enhanced at the National Institute of Allergy and Infectious Diseases Integrated Research Facility in Fort Detrick, Maryland.")


")