GIS is a collection of computer-based tools for organizing information from a variety of data sources to map and examine changes on Earth. It is designed to capture, store, manage, analyze, and visualize all types of geographical data. This NASA GIS Data Pathfinder links to NASA GIS-ready datasets, geospatial services, and tools for accessing data.
Image
Visual representation of data layers or themes in a GIS. Credit: NASA.
A Geographic Information System (GIS) connects a wide range of geospatial data to a map and integrates location data (where things are) with various types of descriptive information (what things are like there). The vision of NASA's Earth Science Data Systems (ESDS) Program is to identify and deliver high value Earth science data in formats compliant and compatible with GIS standards; to ensure data are interactive, interoperable, accessible, and GIS-enabled through primary GIS platforms; and to provide the maximum impact to research, education, and public user communities requiring data visualization and spatial analysis.
A Geographic Information System (GIS) connects a wide range of geospatial data to a map and integrates location data (where things are) with various types of descriptive information (what things are like there). The vision of NASA's Earth Science Data Systems (ESDS) Program is to identify and deliver high value Earth science data in formats compliant and compatible with GIS standards; to ensure data are interactive, interoperable, accessible, and GIS-enabled through primary GIS platforms; and to provide the maximum impact to research, education, and public user communities requiring data visualization and spatial analysis.
This Data Pathfinder provides links to resources for accessing and using GIS-based Earth science data and assumes a basic understanding of GIS and GIS-based applications. If you are unfamiliar with GIS or want more information about some of the terms and concepts described below, please see the Earthdata GIS Backgrounder. Additionally, the GIS Playlist on the Earthdata YouTube channel provides a variety of GIS presentations and tutorials.
Working with Multidimensional Data in GIS
In recent years, GIS software has increased support for integrating multidimensional scientific data formats in their platforms. Two commonly used GIS software programs are QGIS and ArcGIS Pro. If you do not have these software packages, visit the following links for more information:
In tools such as QGIS and ArcGIS, support for raster data can be provided using a mosaic dataset. A mosaic dataset is a data model that acts as a shell to input a collection of multiple raster files, which include different file types, and is viewed as a single image. A multidimensional mosaic dataset stores information about the dimensions and variables as fields in the mosaic dataset footprint table. The underlying raster data do not have to be connecting or overlapping but can be isolated or intermittent datasets. In some GIS software platforms, a single mosaic dataset can then be used to query, process, analyze, and serve data.
NOTE: ArcGIS Pro, on which some Use Cases in this Data Pathfinder are based, is designed to run on a Windows-based operating system. Esri provides an informational page for running ArcGIS Pro on a Mac-based operating system.
Using Synthetic Aperture Radar Data in GIS
Interested in Synthetic Aperture Radar (SAR)? The What is Synthetic Aperture Radar? Backgrounder will help you learn about the benefits and limitations of these powerful data.
Image
Screenshot of the ASF DAAC Vertex data search tool. Credit: NASA's ASF DAAC.
Vertex is a data search tool created by NASA's Alaska Satellite Facility DAAC (ASF DAAC) that provides access to a wide array of archived synthetic aperture radar (SAR) data. It also provides access to On-Demand processing for Sentinel-1, which allows users to generate analysis-ready products such as Radiometric Terrain Corrected (RTC) images or Interferometric SAR (InSAR) interferograms from archived Sentinel-1 data.
There are a variety of GIS applications available to users. The following examples show screenshots from QGIS, a free and open-source GIS application. Other GIS applications have similar options for adding layers.
Adding a Raster Layer in QGIS
Under Layer/Add Layer, select "Add Raster Layer."
Navigate to the directory location to select the file and click "add."
You may need to modify the projection or symbology, both of which are in the layer properties. Layer properties can be accessed by double-clicking on the layer or by selecting "Layer/Layer properties." "Layer Properties" is the window title within QGIS and "Properties" is the window title in ArcGIS Pro.
Here you can also alter band combinations, adjust brightness, and opt for different color schemes.
At this point, you can visualize your data.
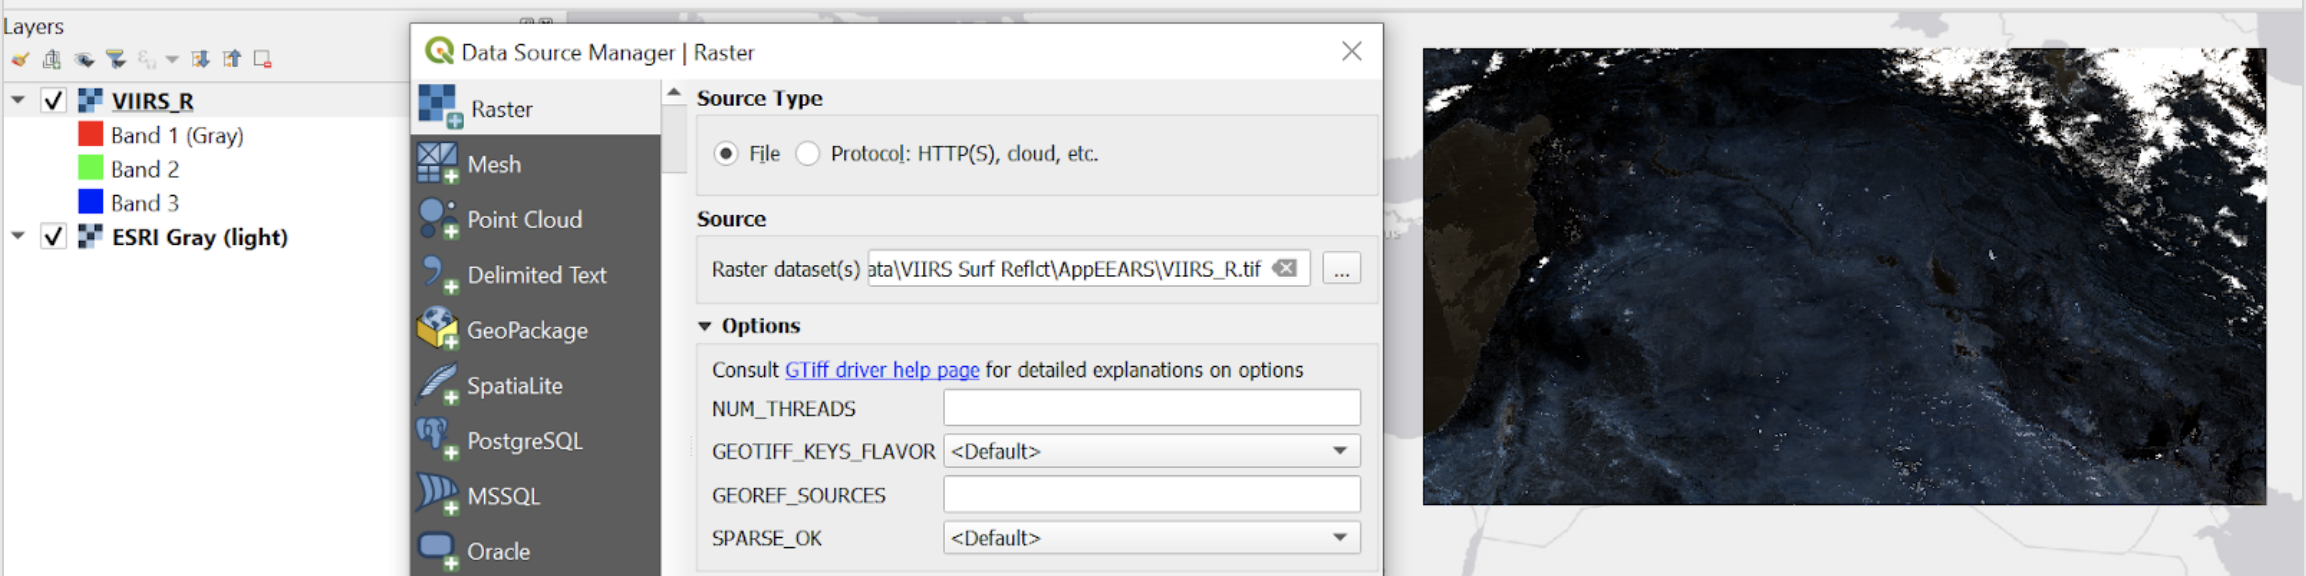
Adjusting Band Rendering and Color Rendering
Image
Adjusting Band Rendering and Color Rendering
Image
Adjusting Band Rendering and Color Rendering
Adding a Raster Layer in ArcGIS Pro
First, download the target raster TIF, HDF, or NetCDF data. In these examples, we will be adding the ASF (1) Median Coherence data, accessed from this Open Data Registry (ODR) link and the (2) GPM IMERG data from their data download directory.
For the first workflow, users may use the New Cloud Storage Connection function by right clicking on a void space in the catalog. This will open the dialogue below, where the input for the ODR bucket has been pre-populated. The bucket name is acquired from the name subset of the Amazon Resource Name (ARN).
Image
After adding this connection, navigate to the mosaics folder and select a target .tif file. Alternatively, download from one of the sample https requests listed in this documentation for GLOBAL SEASONAL SENTINEL-1.
For the second example, navigate to IMERG Final Run and view the download link on the right as shown below:
Image
After downloading the files, you can access the data using two different methods. The first is (A) Add Data dropdown to Multidimensional Raster Layer option. Point to the NetCDF downloaded, select the particular variable, and (optionally) specify extent. The second is to use the (B) Make Multidimensional Raster Layer geoprocessing tool of (B) The sample below shows an HDF downloaded from the IMERG download directory.
Image
For additional information regarding time navigation, raster functions, and multidimensional properties, view the Analytics section on Adding an Image Service in ArcGIS Pro subheader.
Adding a Vector Layer
Adding a Vector Layer in QGIS
Under Layer/Add Layer, select "Add Vector Layer."
Navigate to the directory location to select the file and click "add." Note: you can add the entire zip file, then select specific layers to add.
At this point, you can visualize your data.
Image
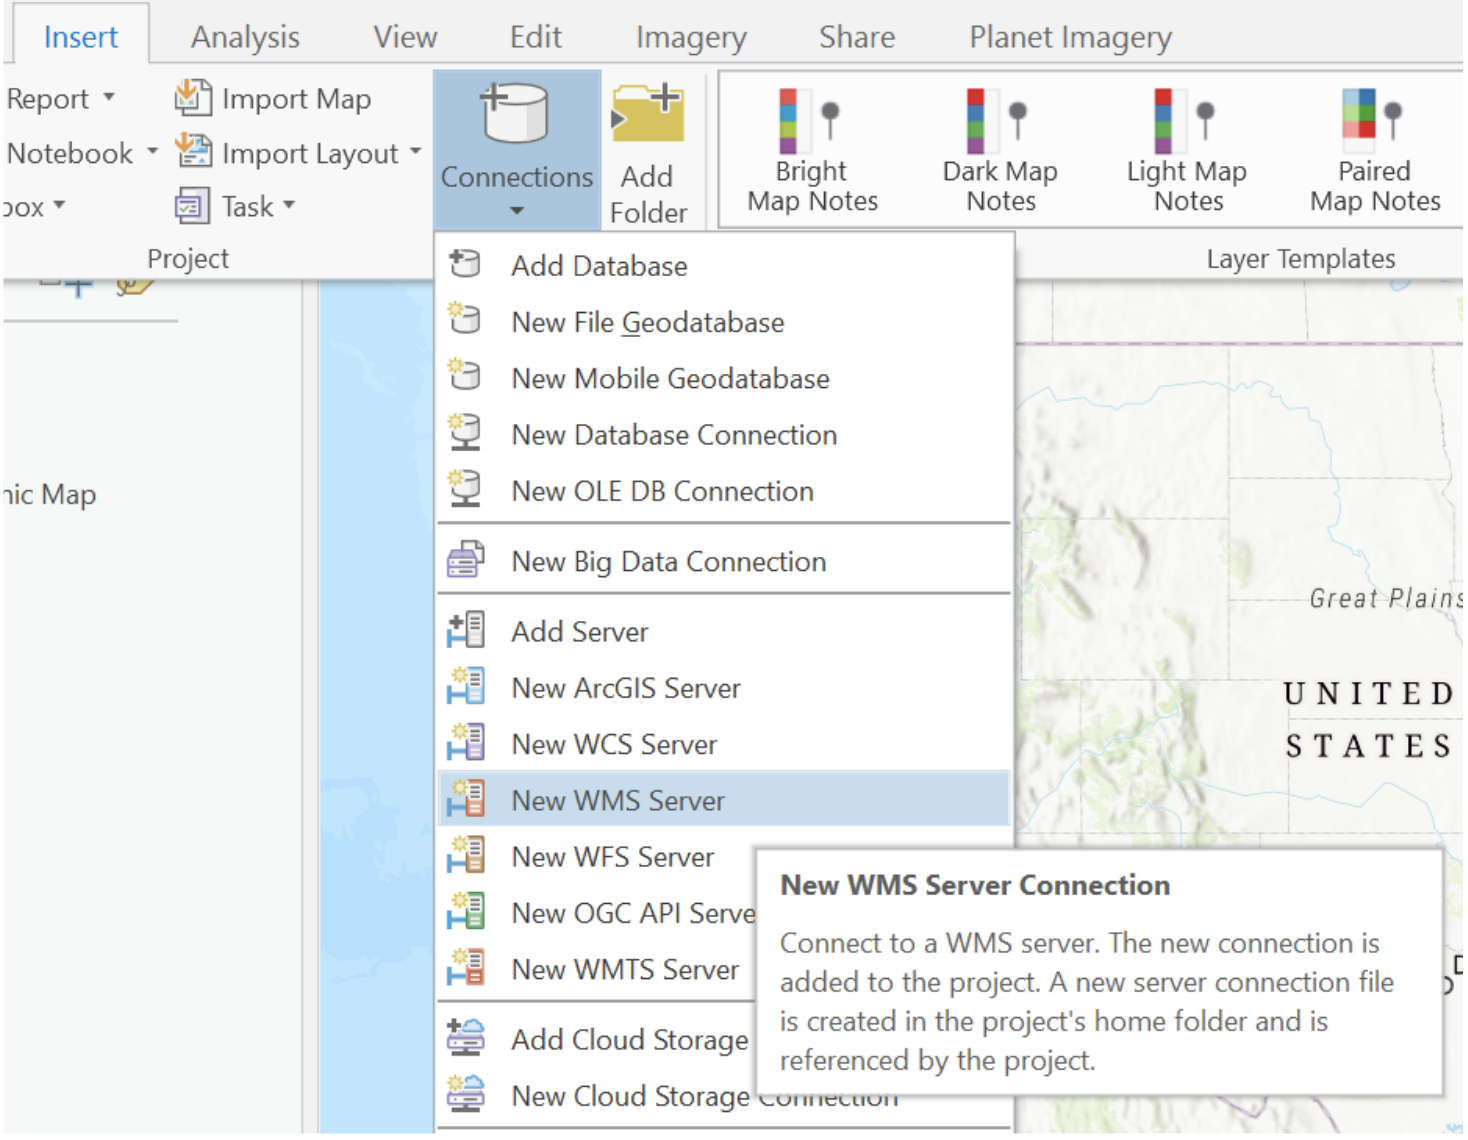
Adding a Web Map Service
Adding a Web Service to a GIS
Web services offer a great way to discover and explore NASA Earth observations without having to download data files. NASA provides a variety of data services in various formats such as Open Geospatial Consortium (OGC) Web Mapping Services (WMS), Web Feature Services (WCS), Web Processing Service (WPS) as well as ArcGIS Image Services. Below are generic instructions for accessing and using web services within QGIS and ArcGIS tools. See Use Cases for Web Services to see examples for each service.
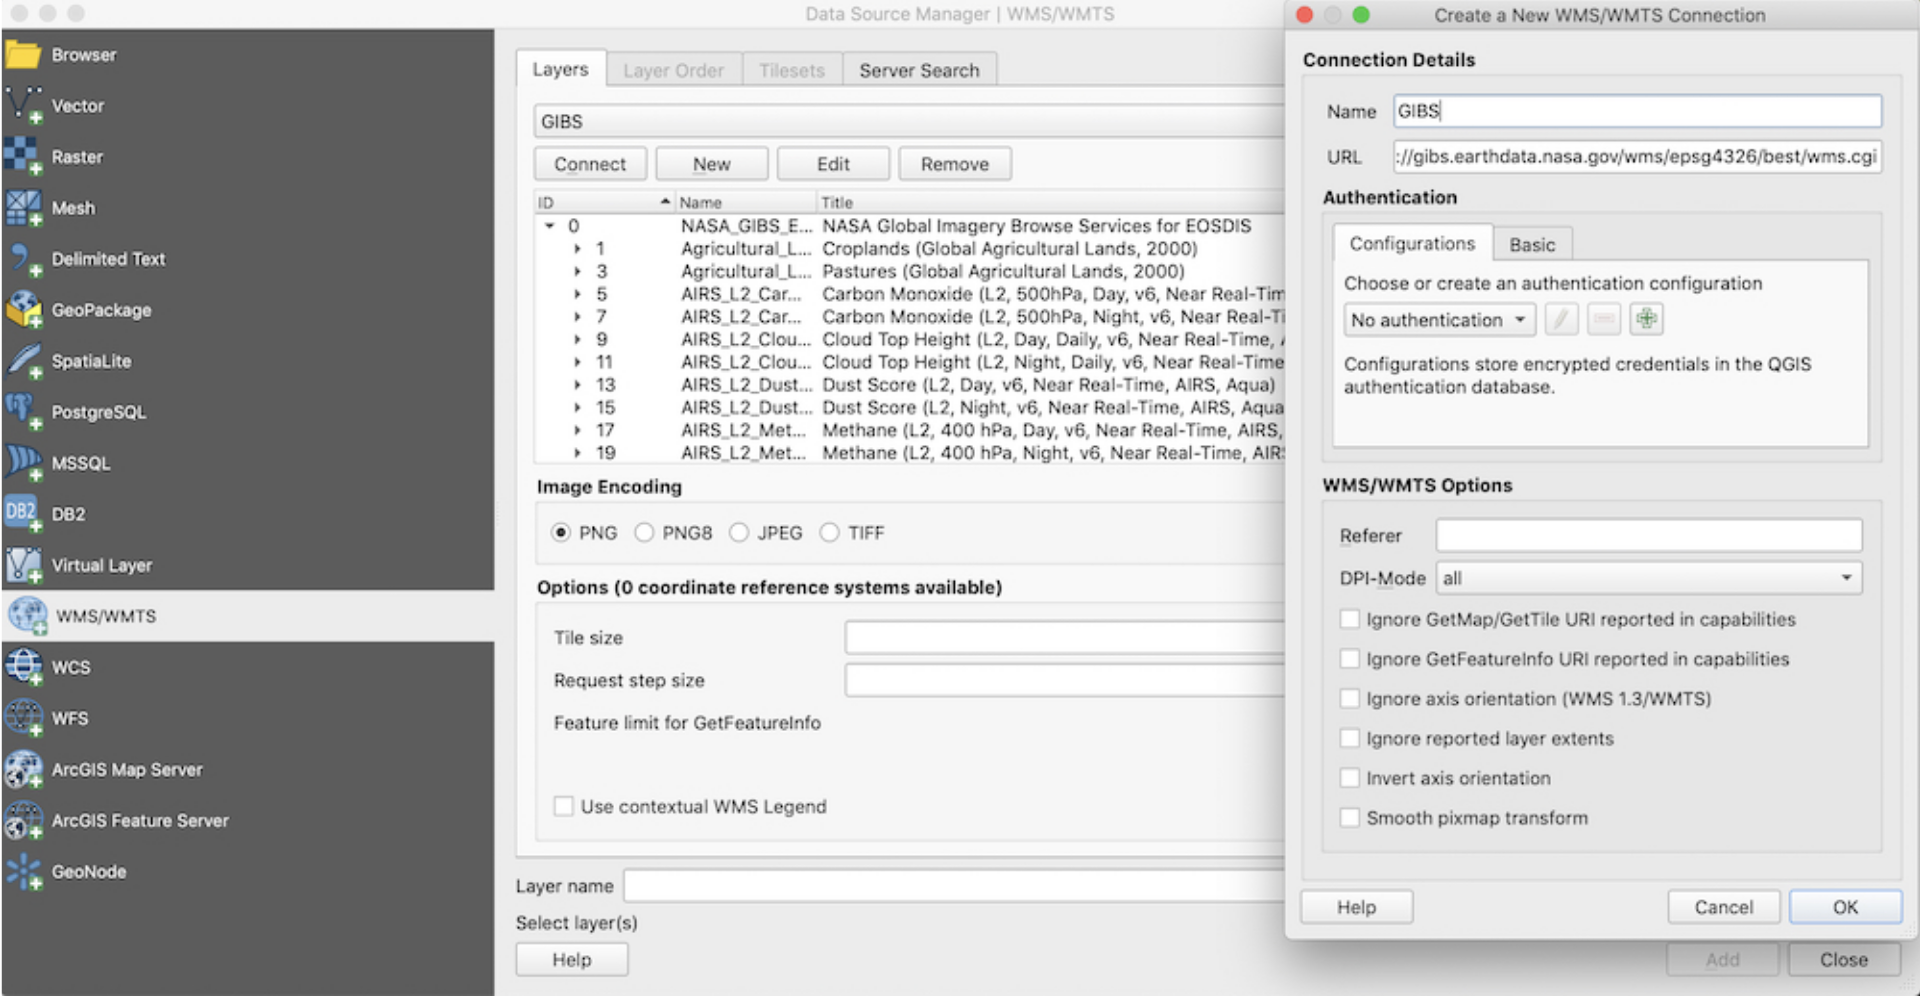
QGIS:
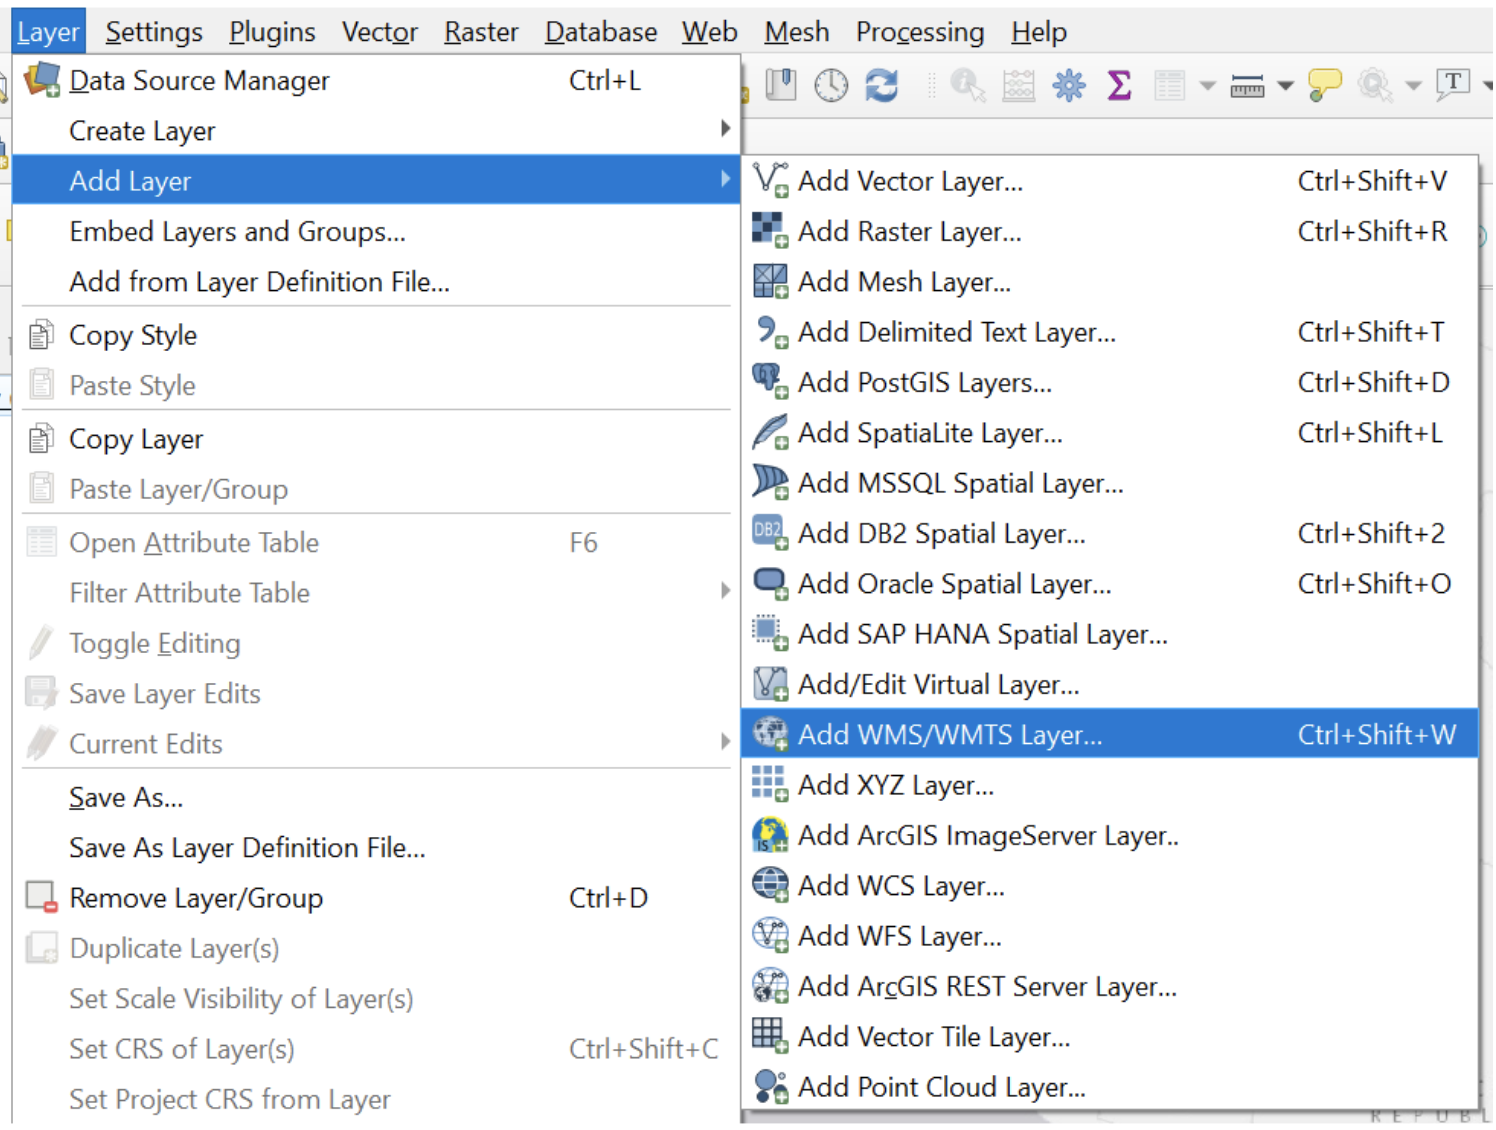
Under Layer/Add Layer, select "Add W*S Layer" (* denoting the type of service you plan to connect to)
2. Click "New" to add a new endpoint using the specific URL then click “OK”
3. Click "Connect" to access the services available.
4. Choose the content you desire to view and click “Add” for the service to be brought into your map viewer
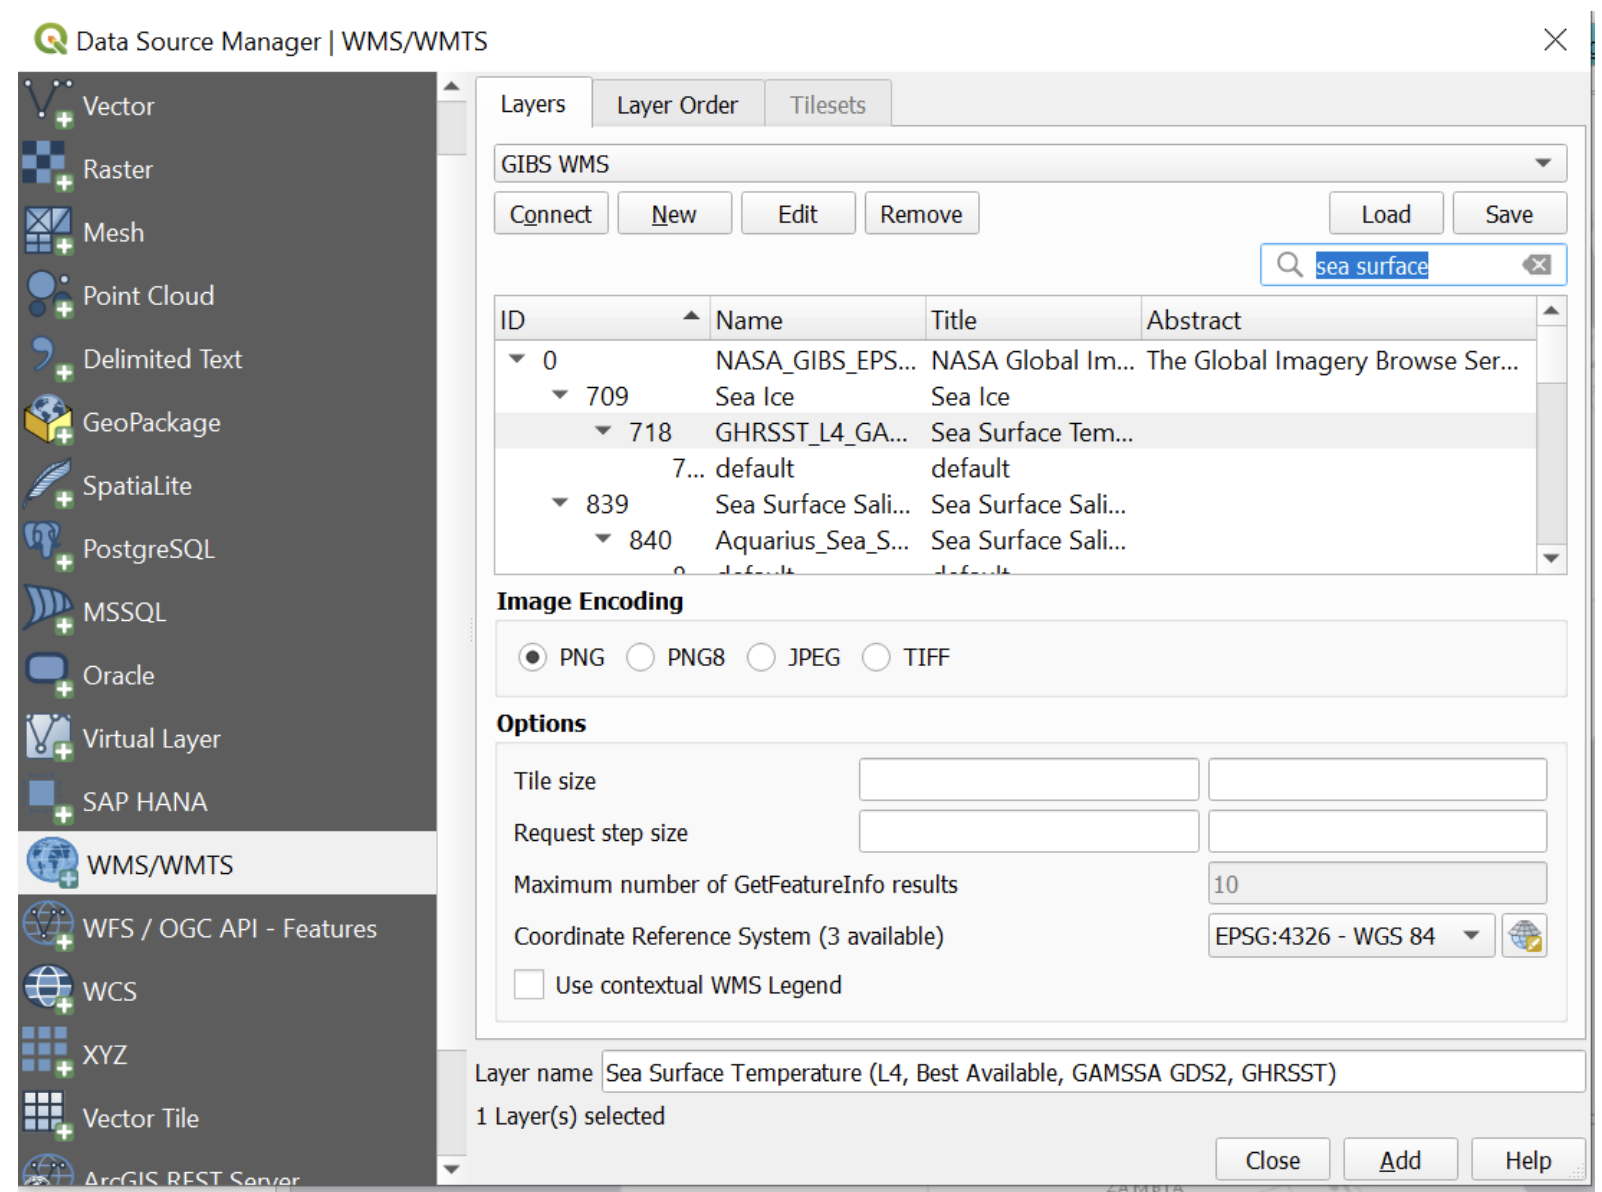
Example for bringing in the 1,000+ Global Imagery Browse Service (GIBS) time-enabled OGC WMS endpoint: https://nasa-gibs.github.io/gibs-api-docs/gis-usage/#qgis
Now you can visualize the imagery as well as control the temporal range available for the data collection.
Image
ArcGIS Online (AGOL)
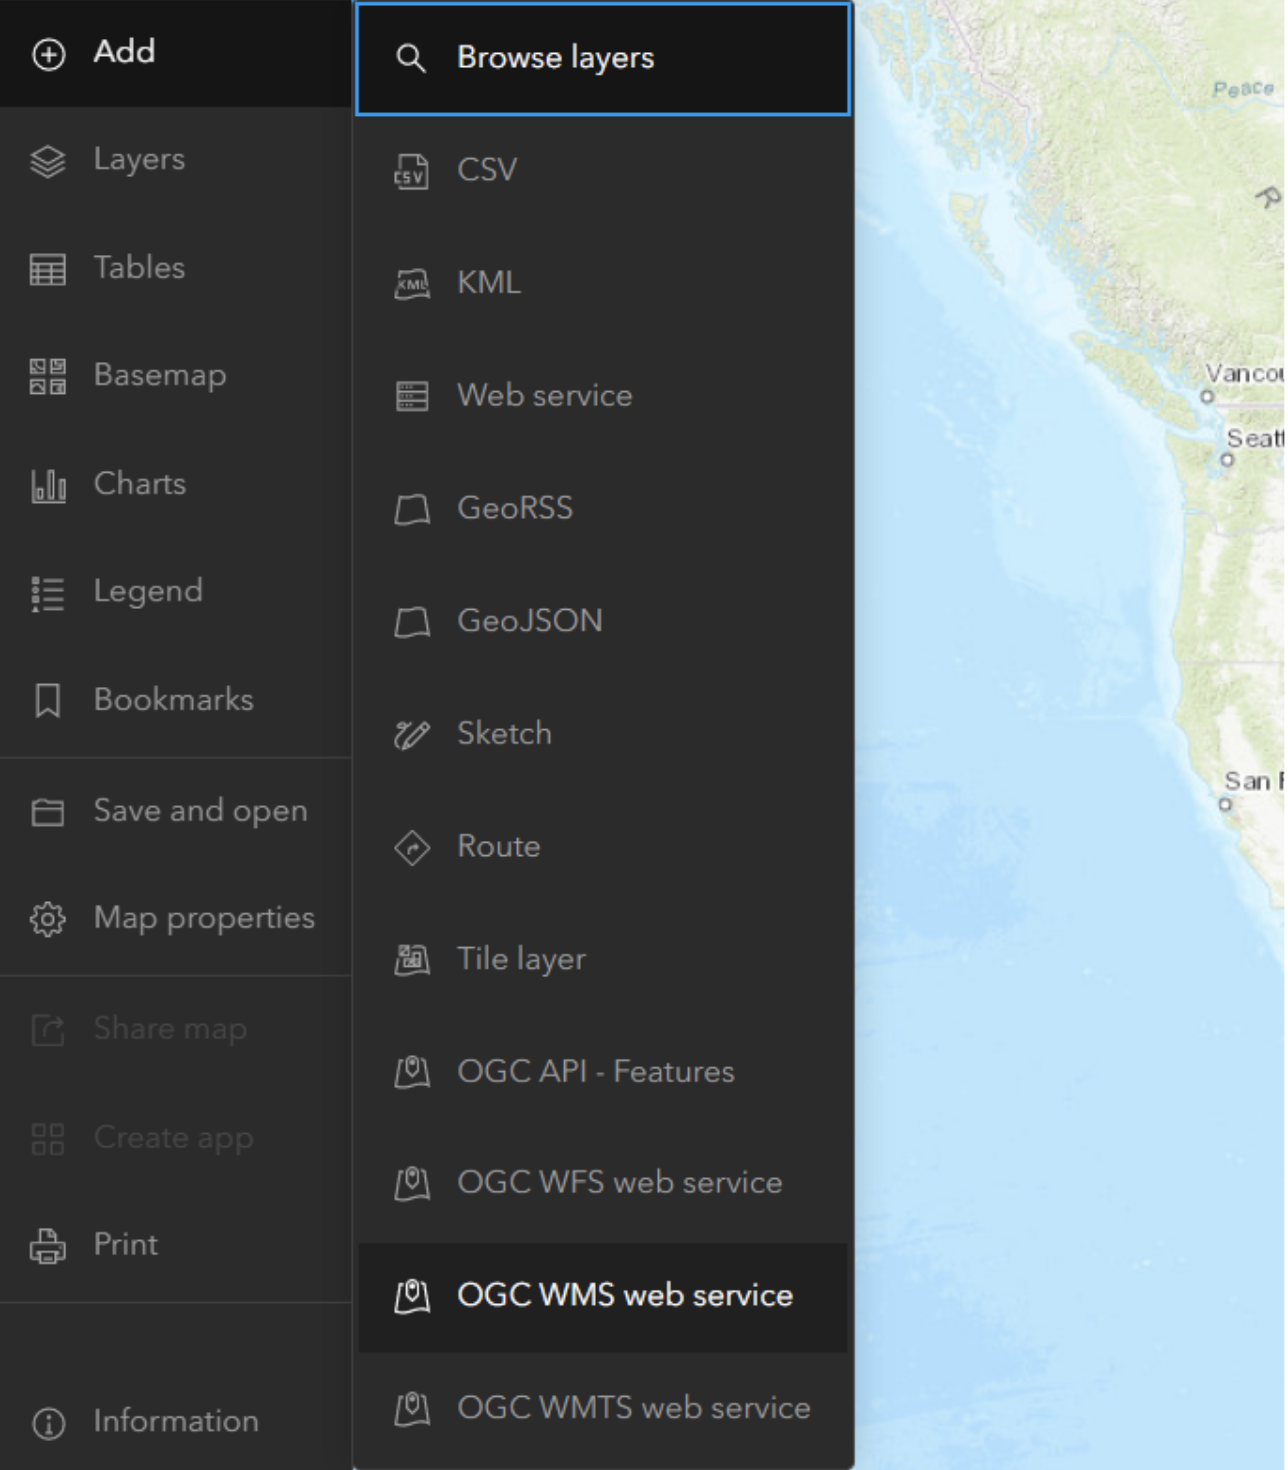
1. From the Map Viewer interface, click “Add”
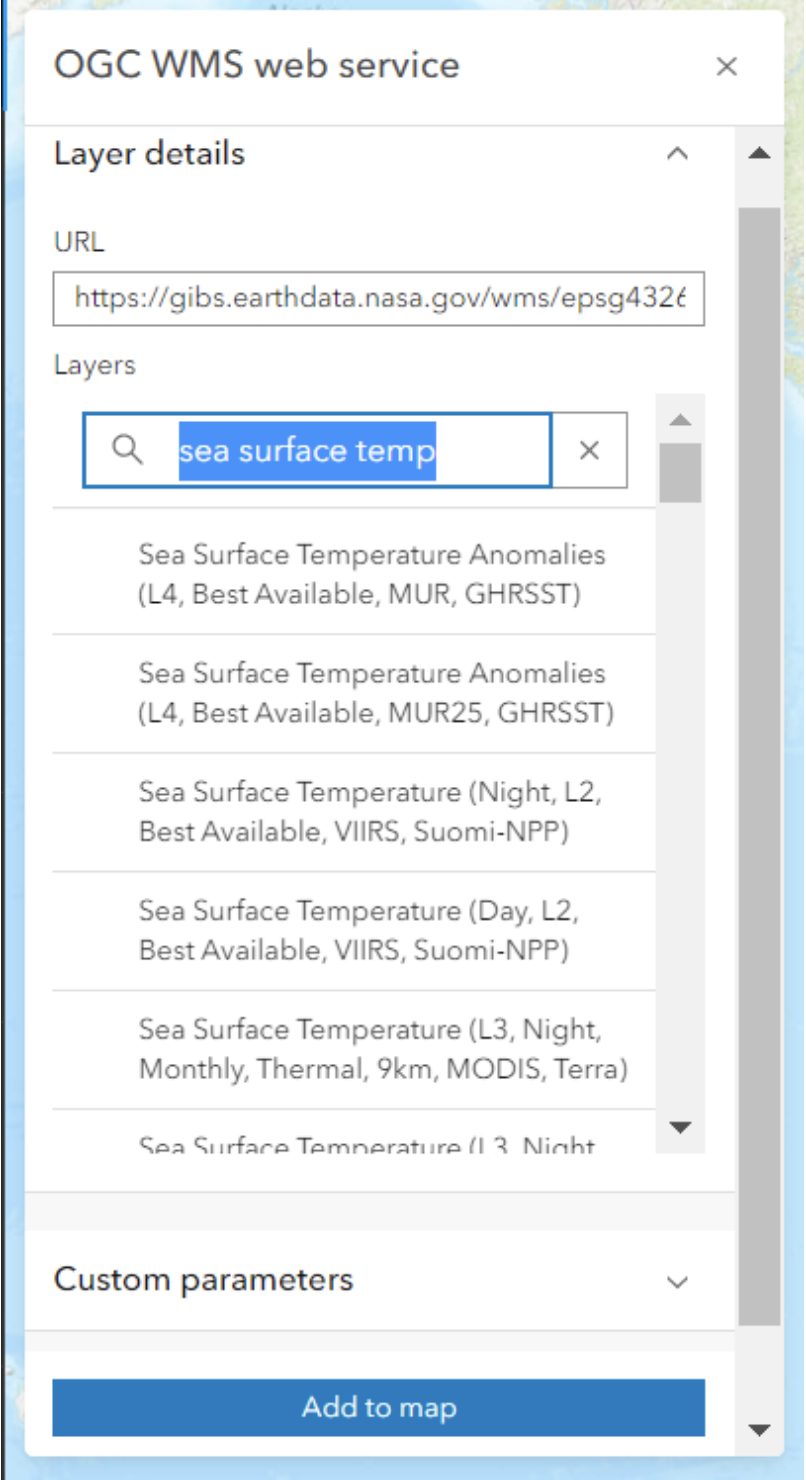
2. Select the service type (i.e. OGC W*S web service)
3. Enter the endpoint using the specific URL for it to automatically connect
4. Choose the content you desire to view and click “Add to map” for the service to be brought into your map viewer
There are two easy ways to add an Image Service using ArcGIS Online.
First, if searching an online repository such as an organization’s Portal gallery or the Living Atlas, from a content item page, you can chose to:
1) Open in Map Viewer to show the data in a web-based map visualization or,
2) Click View on the URL on the bottom right
Image
Viewing the URL opens a page where you have the option to open the service in a variety of clients:
Image
Second, if you already have the endpoint you wish to open in a map viewer, you can open a new or existing map and click the “+” button to Add layer from URL
Image
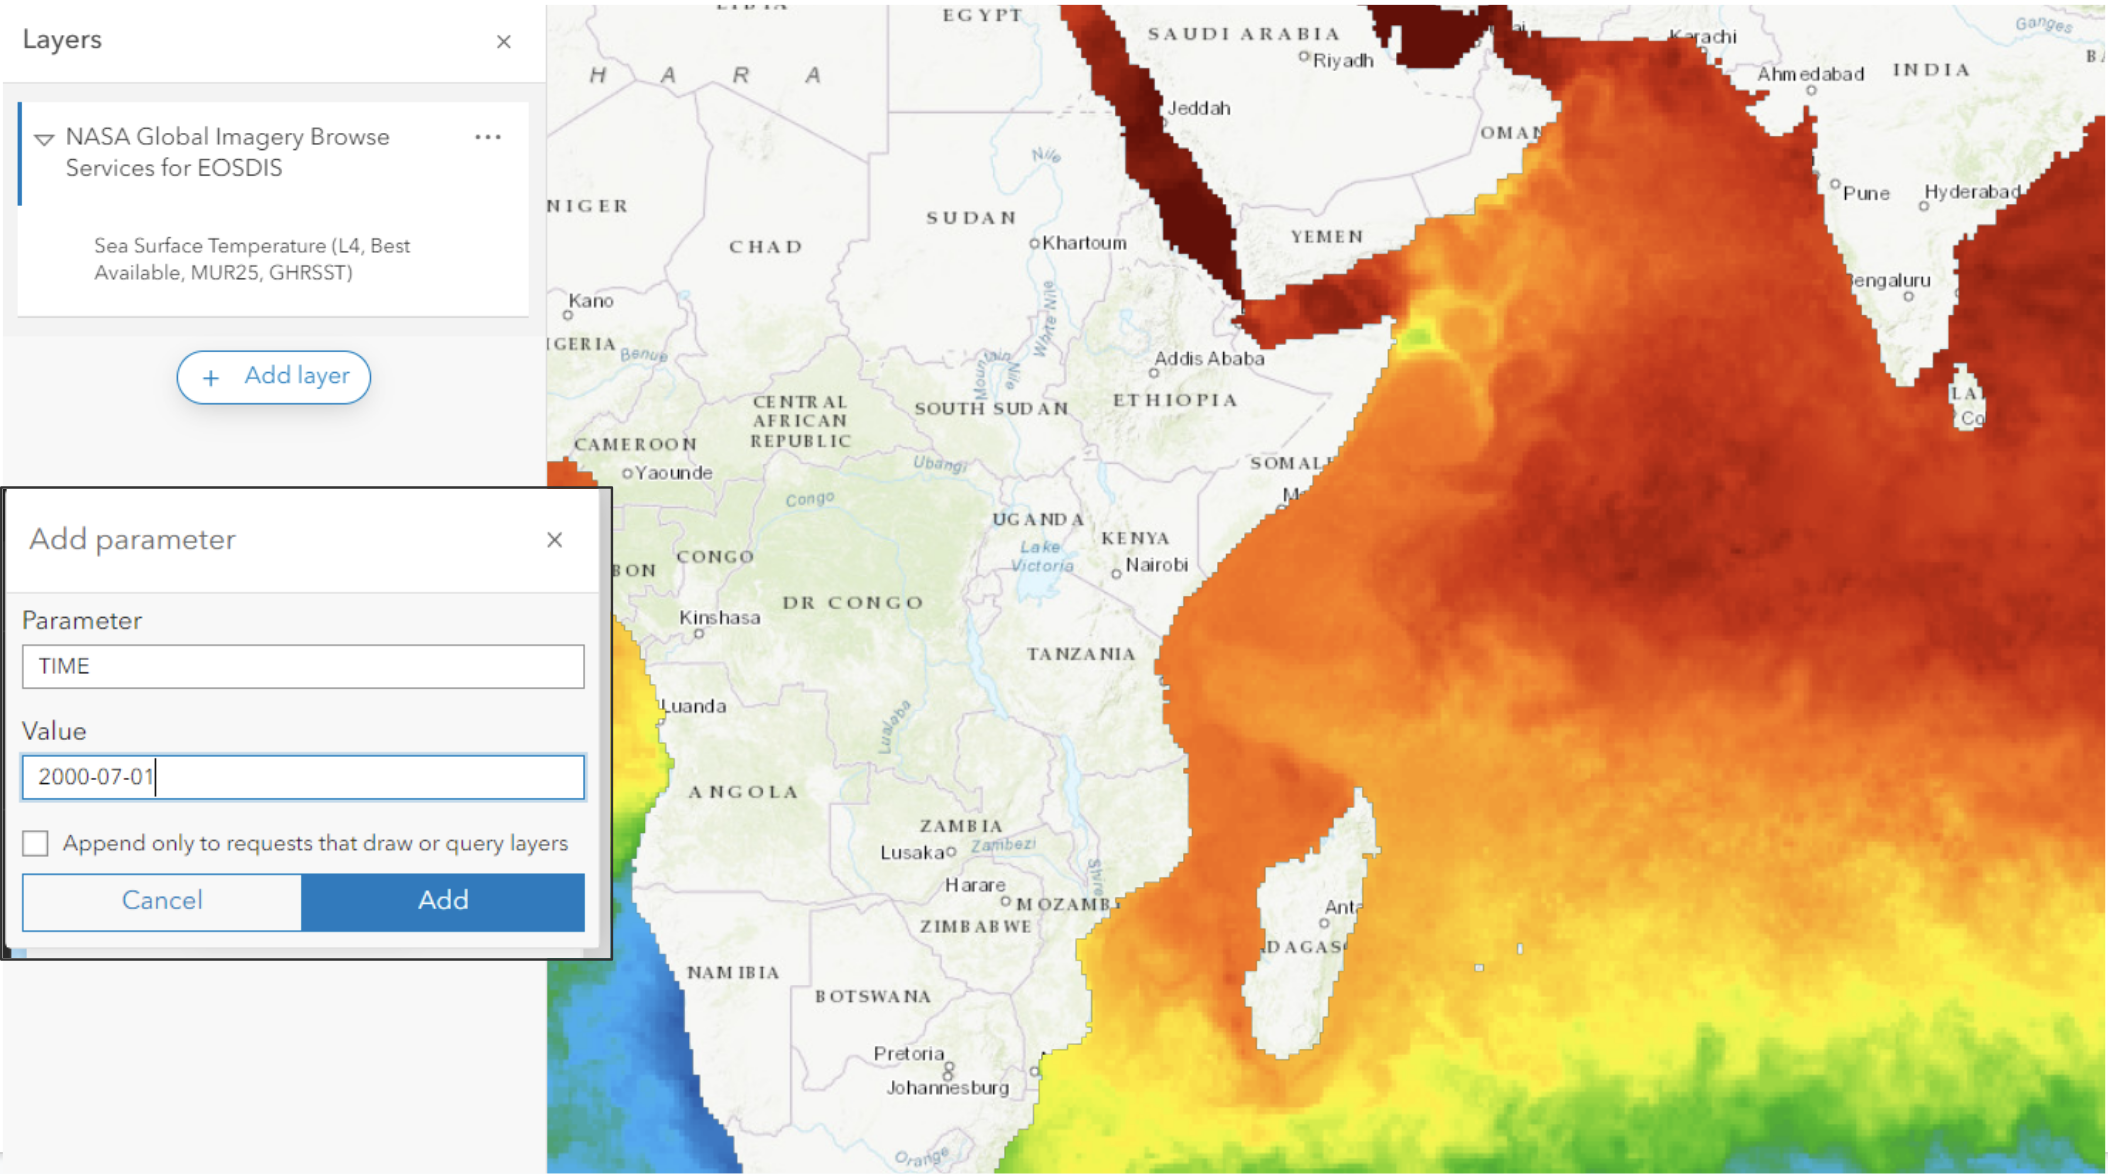
You can then copy and paste the URL into the window and select the service type as well as customize parameters, if desired, and Add to map
Image
Once in the map viewer, Image Services allow you to interact with the underlying data and customize the visualization.
Image
For further customization on visualizing individual slices, users may access the Multidimensional tab (A), where individual slices can be loaded (such as in time or dimensions) or (B) time slider toggle, where users may specify time scales.
Image
Using an Image Service at a REST Endpoint
When following a web service to its source data URL, a user will end up at the REST endpoint of an ImageServer. The REST endpoint typically has a variety of visualization and analytic capabilities that can access the underlying data directly on the web, such as multidimensional information, OGC access, and querying.
Image
From the endpoint landing page, users can scroll to the bottom and can take advantage of supported visualization and data query operations:
Specific data on slices can be queried using variable designations and time stamps. Many other features including, but not limited to, acquiring data samples, performing identify functions, are available and are documented in the technical ArcGIS REST API.
Adding an Image Service in ArcGIS Pro
Image services can be easily added for robust visualization and analytical processes using ArcGIS, a commercial off-the-shelf licensed Desktop product.
Visualization
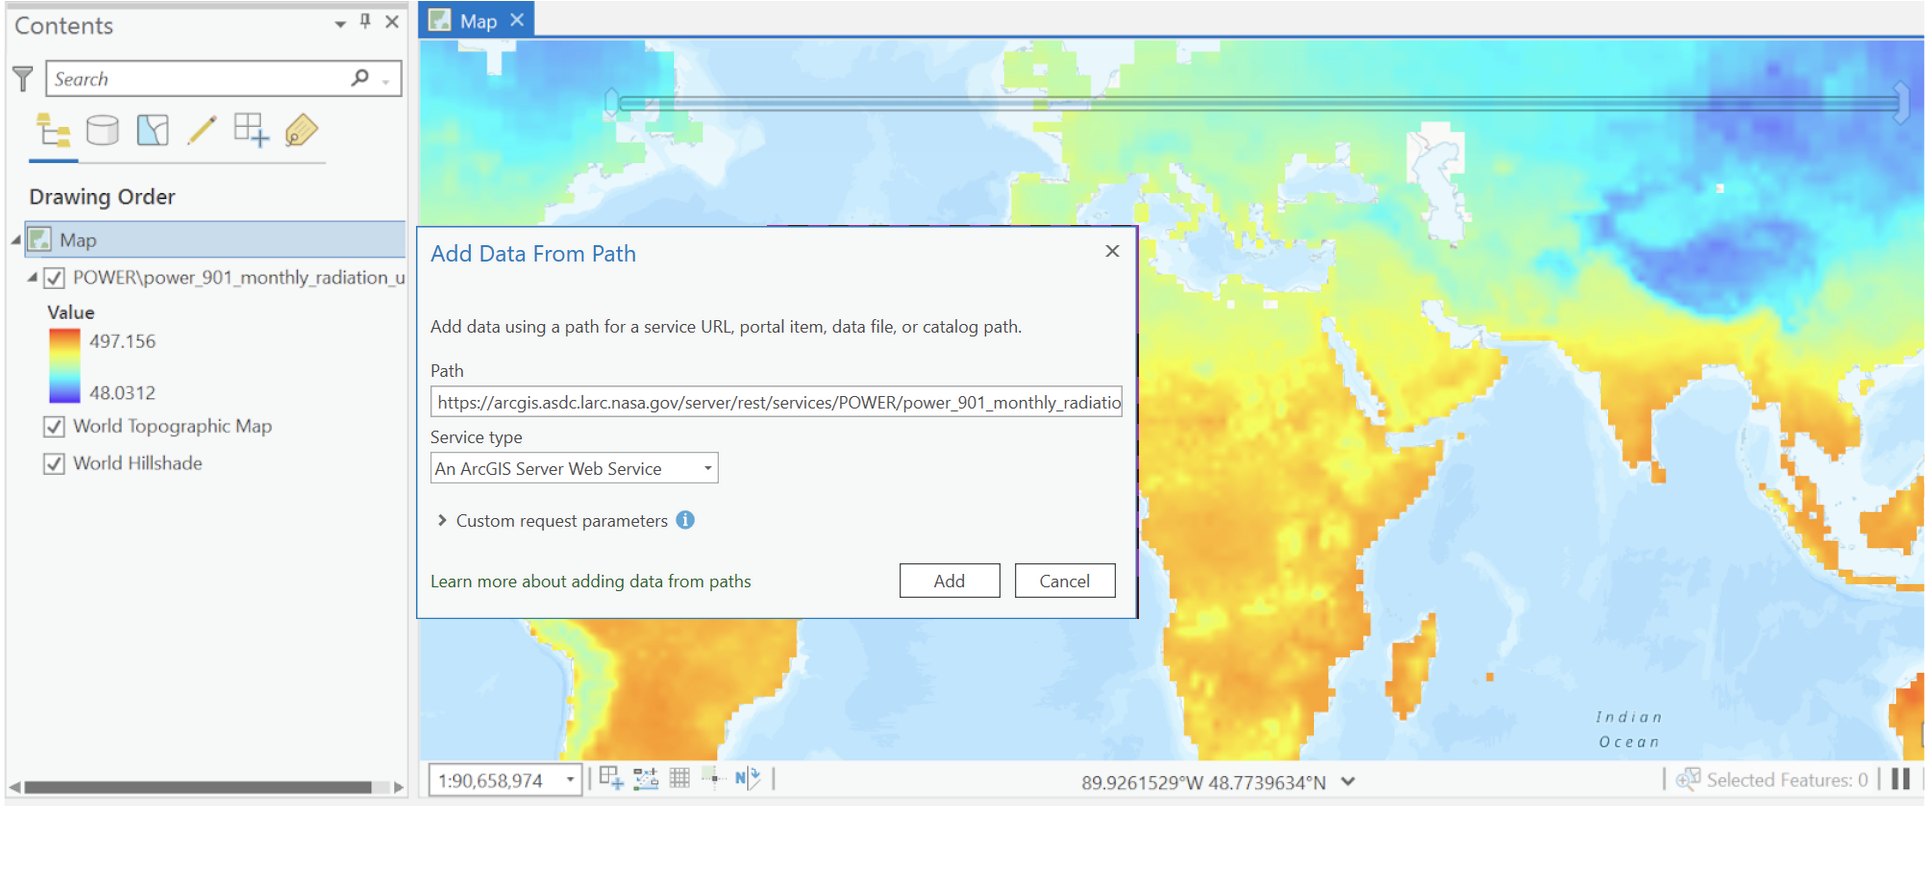
Data may be directly imported from a REST endpoint by accessing the Map tab, the Add Data drop down, and Data From Path option to copy in a URL of an image Service. For this example, we will be using the SEDAC Gridded Population of the World (GPW) Count Image Service.
Image
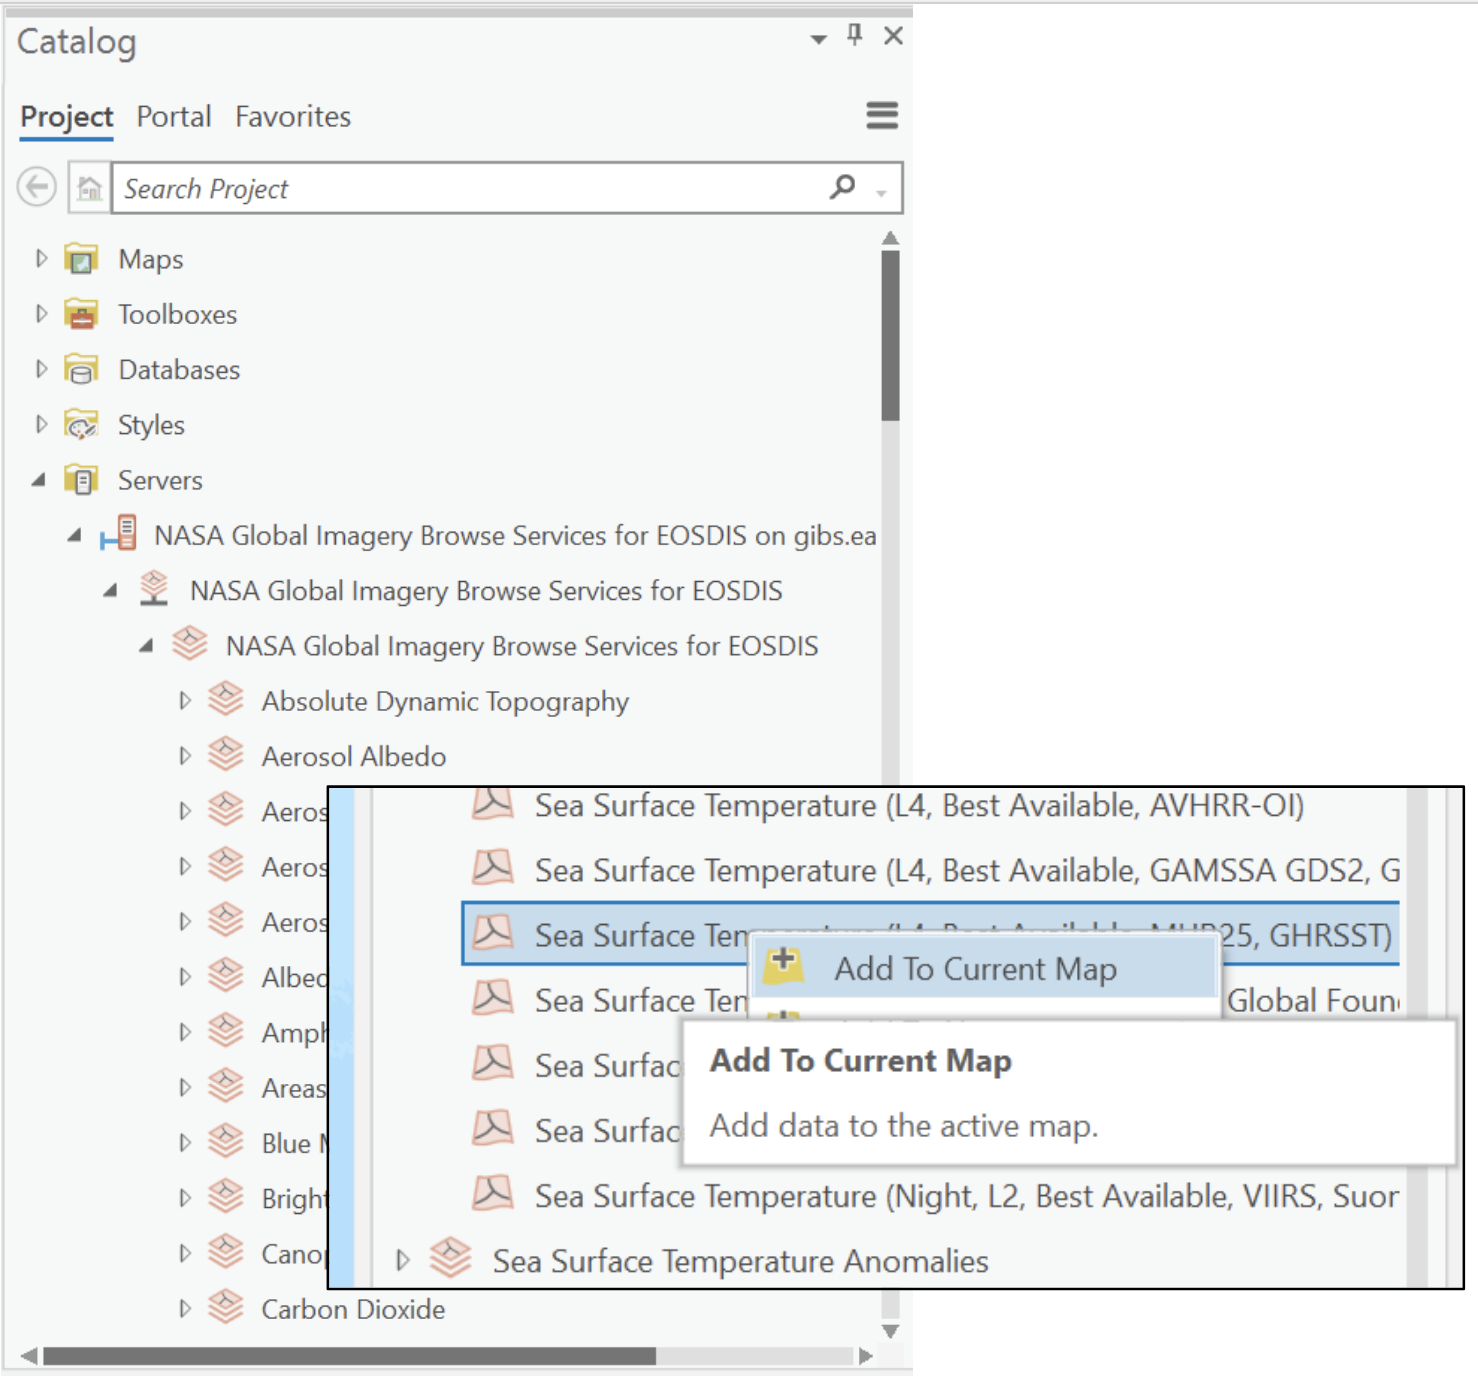
Alternatively, users may add data via connections for servers they may frequent or use multiple services from using the Catalog pane Favorites tab:
Image
Analytics
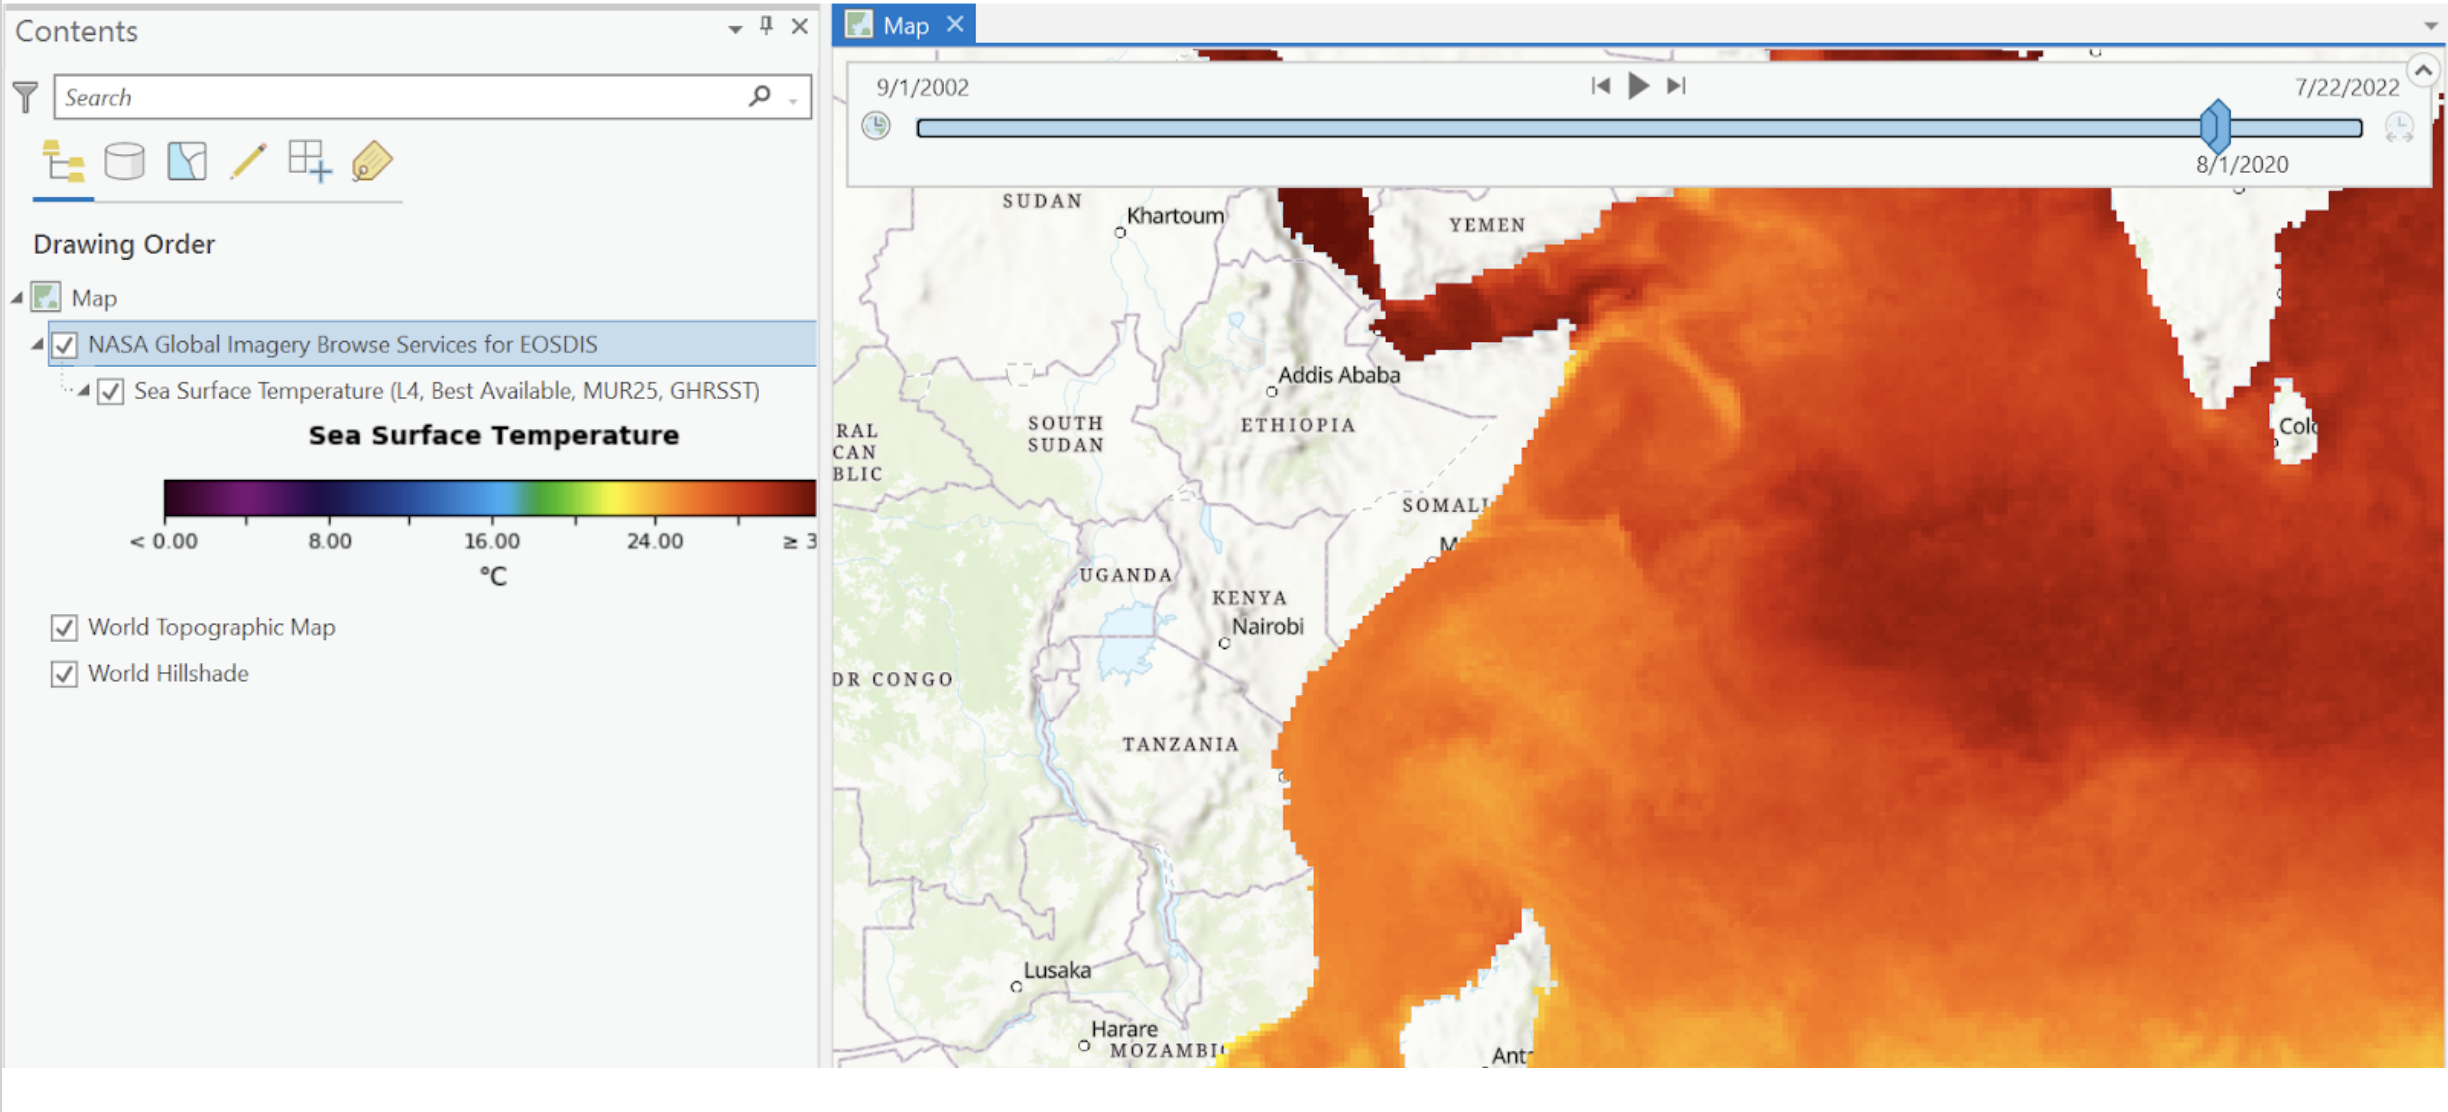
Image Services contain underlying data and within ArcGIS Pro, many raster functions and analytic tools are available for use across the collection. For this portion of the tutorial, the POWER Monthly Meteorology layer is used to demonstrate temporal capabilities.
Once imported, users can filter down specific multidimensional variables from a given service if they exist by using the Image Service Layer Multidimensional Tab. Note the layer should be selected on the Contents pane for available capabilities to be shown on the task bar. For this example, we will be using the 2-meter Temperature parameter (T2M).
Image
You may access the Map Time (a) tab, ensure Time is enabled (b) and the start and end dates should be shown. There will also be a time bar (c). Users may now hit the Play button on the time bar to start iterating through various time slices. Any time slice can be queried using the Explore function on the Map tab.
Image
The multidimensional portion of the Image Service Layer tab contains a plethora of tools to analyze, create subsets, and distill insights. For example, the Temporal Profile tool can be used to observe trends:
Image
Finally, there is a thorough suite of Raster Function Templates and custom Raster Functions that can be used and built in the Analysis tab.
Image
Many of these are mathematical (statistics, unit conversion, aggregation, arithmetic) or geospatial (clip, mask, transpose, interpolation) in nature, but there are others that cater to specific types of data e.g., Heat indices from POWER relative humidity and temperature.
Image
Adding an Image Service in QGIS
Image services can be easily added in open source tools such as QGIS. While there are many plugins available, not all are maintained or updated therefore we will only showcase what is included out of the box via the Data Source Manager interface.
ArcGIS REST Server Connection
Demonstration shown using 3.30.1. Open the Data Source Manager and add ArcGIS REST Server, from which we will add in our Image Service.
Image
If you have a portal, such as the enterprise Earthdata GIS service directory, you can connect to that endpoint to access the full catalog of available services. To do this, enter the URL and provide a name before clicking OK.
Image
Once connection details are saved, click Connect to display the catalog of content available
Image
Navigate to the content item you wish to visualize and click Add
Image
If you have a specific service URL available, you can add that individual item directly by entering the endpoint in the URL, and provide a name before clicking ‘OK’.
Image
Click ‘Connect’ and then ‘Add’ to map to display content
Image
OGC (WMS) Service
Image services being deployed in the enterprise Earthdata GIS will have Open Geospatial Consortium (OGC) service endpoints, specifically Web Mapping Services (WMS) and/or Web Coverage Services (WCS). QGIS can ingest WMS layers by accessing the Layer drop-down menu, selecting Add Layer, and Add WMS/WMTS Layer from the submenu. Use the connection wizard to create a New Connection and link directly to WMS URLs. NASA Earthdata GIS WMS/WCS endpoints are found on the top left of the ImageServer REST endpoint web page. Below is an example import of the POWER Monthly Meteorology layer.
Image
Image
Once connected to the WMS layer, users can select the underlying layer to load it into QGIS. For this specific image service, the Image Encoding should be set to JPEG for maximum functionality. In experimenting with other WMS layers, it is recommended to test various encodings if the initial import is unsuccessful or unsatisfactory.
Accessing Individual Time Slices via WMS Queries
Enhancements to multidimensional Image Services in QGIS are ongoing. Users may notice limited capabilities in querying data and accessing sublayers - including service variables and time slices.
The latter issue can be addressed using WMS encodings via the Add WMS Layer or using Python (using the qgis.utils.iface.addRasterLayer method). Individual sublayers can be accessed using the WMS argument LAYERS. Time slices can be queried using the TIME or DIM (+custom dimension name) arguments (applicable for CRF-based services per section C.3.3 of the WMS specification document). Consider the following WMS request for the Annual Meteorology Layer:
Both argument name and options can be found in the WMS GetCapabilities XMLas follows:
Image
Time support and syntax information can be found on GeoServer. Once a URL has been constructed, users may follow the WMS workflow or use the Python method discussed above.
NOTE: The following Use Cases and screenshots are created using QGIS.
Web Feature Service (WFS) from NASA's Socioeconomic Data and Applications Center (SEDAC)
Storm surges from hurricanes pose numerous threats to health and the environment. In areas where U.S. Environmental Protection Agency (EPA) Superfund sites may be inundated, the concern that toxins will be dispersed is great. However, the level of concern varies widely depending on the specific contaminants and their concentrations. The EPA assesses where Superfund sites exist, the vulnerability of these sites, and the risk to surrounding communities when a large storm surge is expected. This use case is adapted from a CNBC news article and the EPA Hurricane Harvey Report.
Concerned about an approaching hurricane expected to hit the panhandle of Florida, you want to look at Superfund sites in the area and the population density surrounding these areas to assess potential effects. Through SEDAC's WFS, you can directly access these data within a GIS.
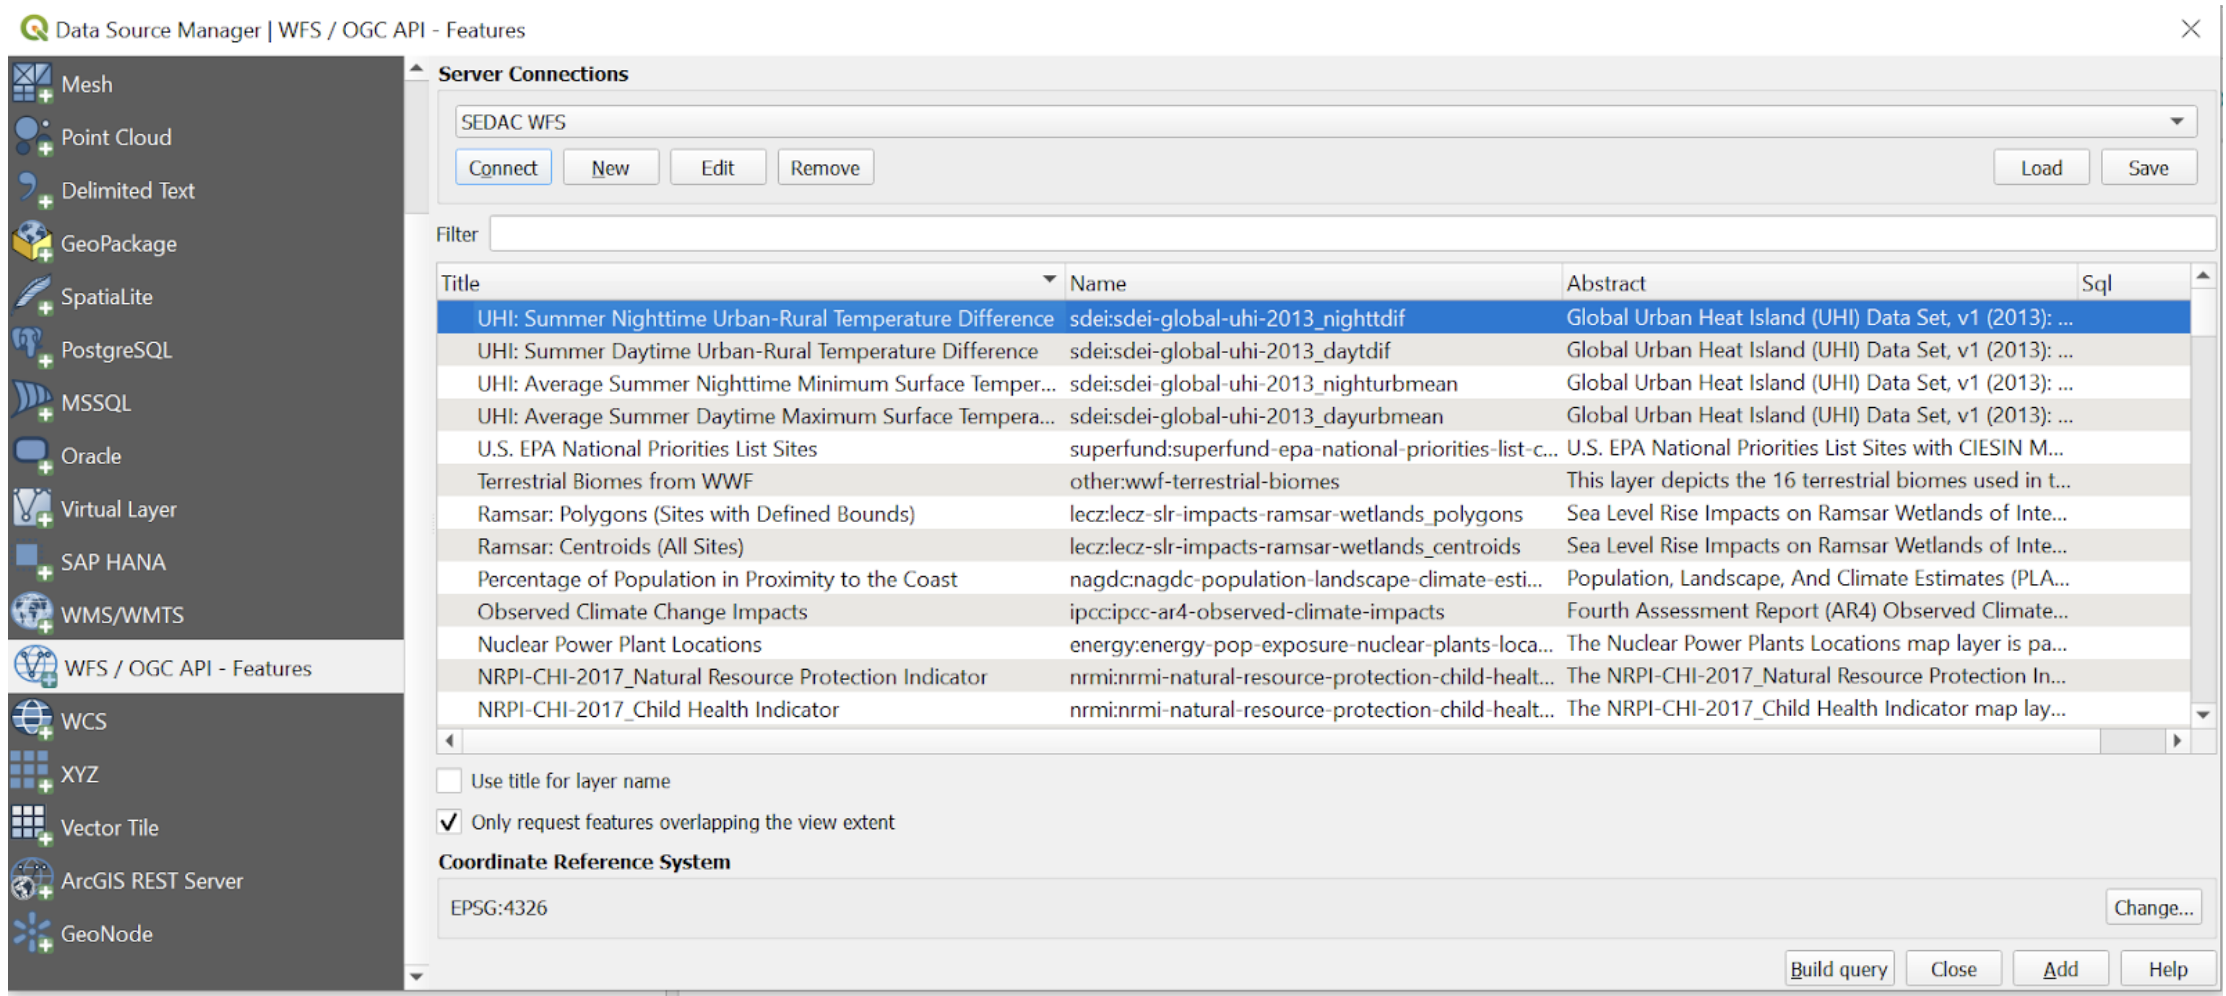
To add a Web Feature Service:
1. Proceed to Layer and "Add a WFS Layer." Provide a name and insert this URL: https://sedac.ciesin.columbia.edu/geoserver/ows?version=1.1.0
2. You can now access and query the catalog of services available. Identify the content of interest and click to add to the map.
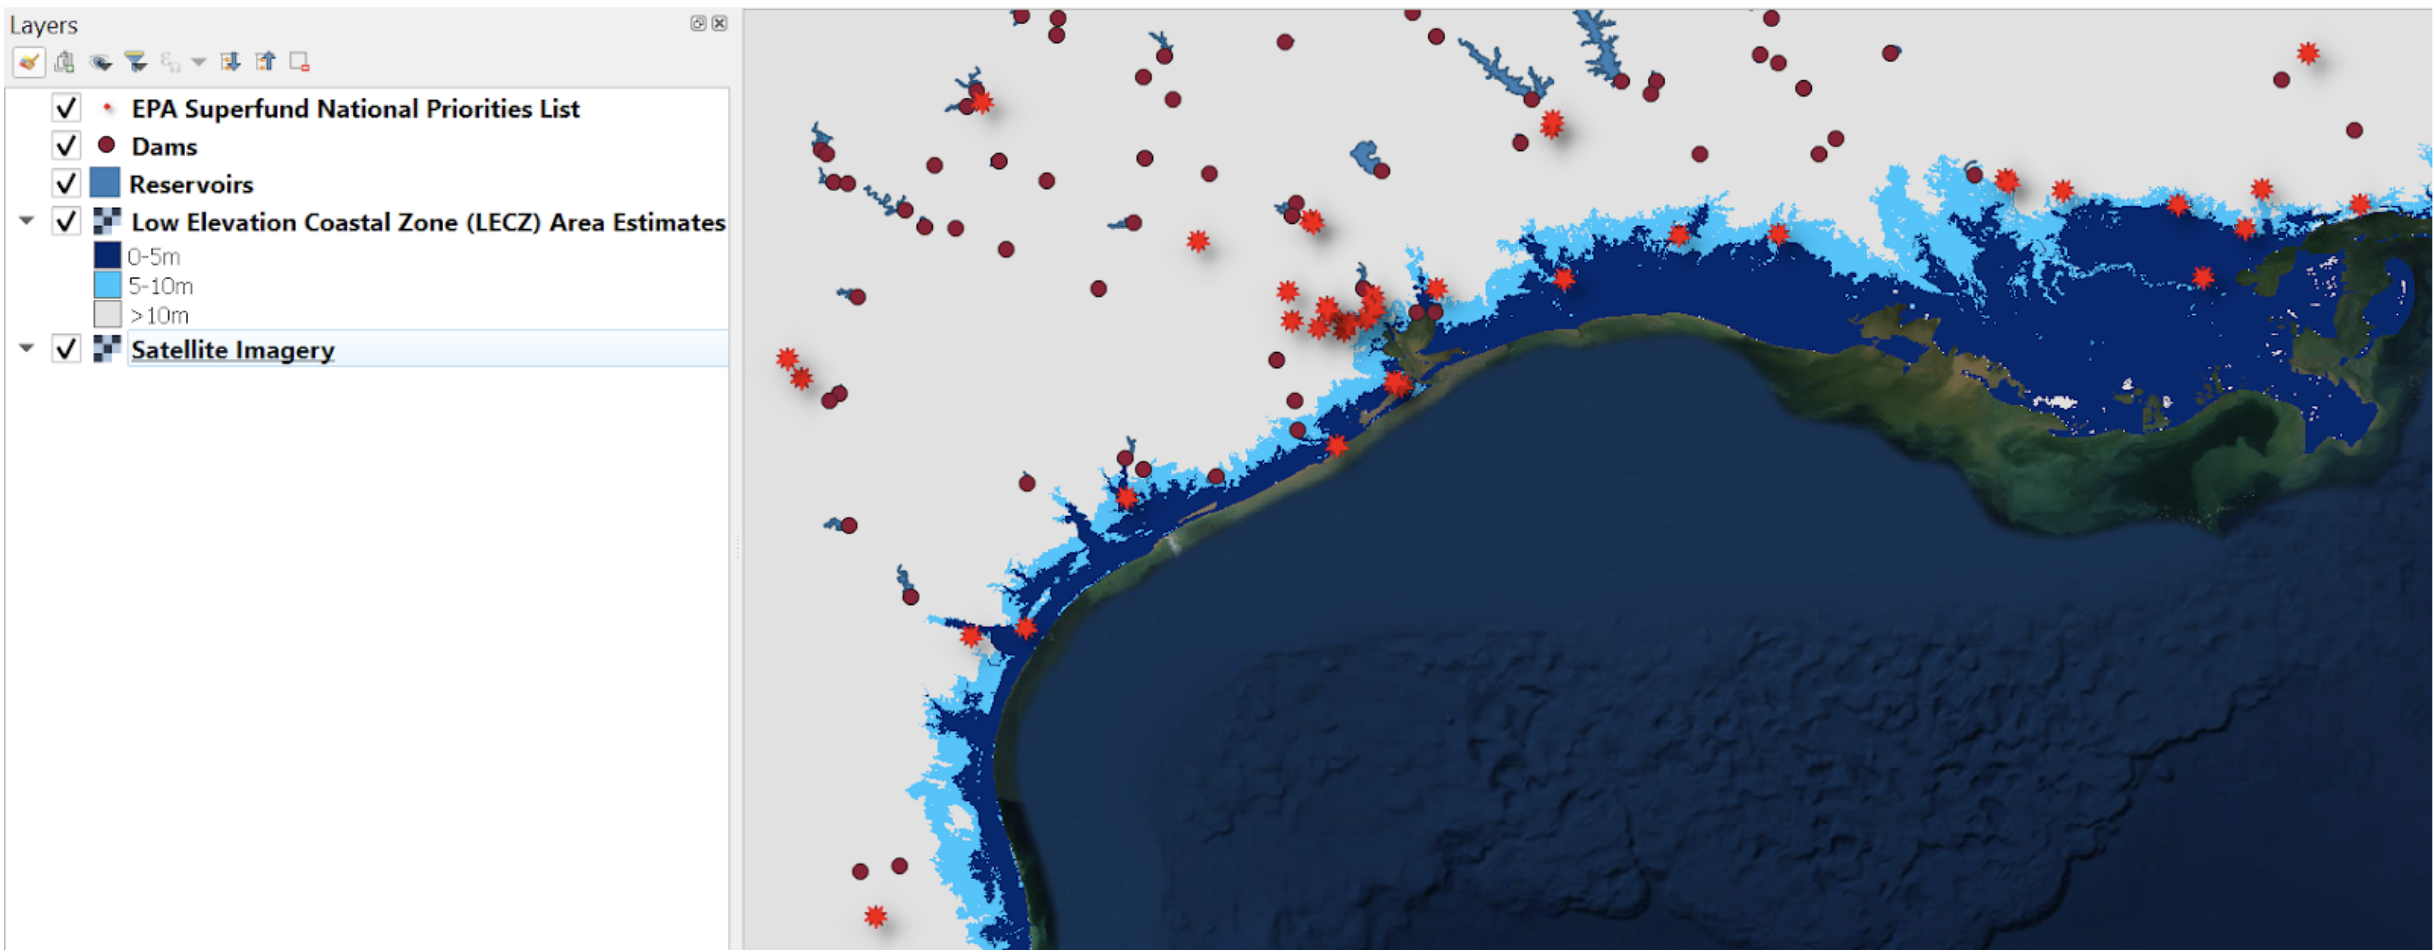
3. Here we bring in SEDAC’s global dams and reservoirs data, Low Elevation Coastal Zone Urban-Rural Population and Land Area Estimates, and EPA Superfund sites along the coast to identify potential impact areas of concerns.
Web Map Service
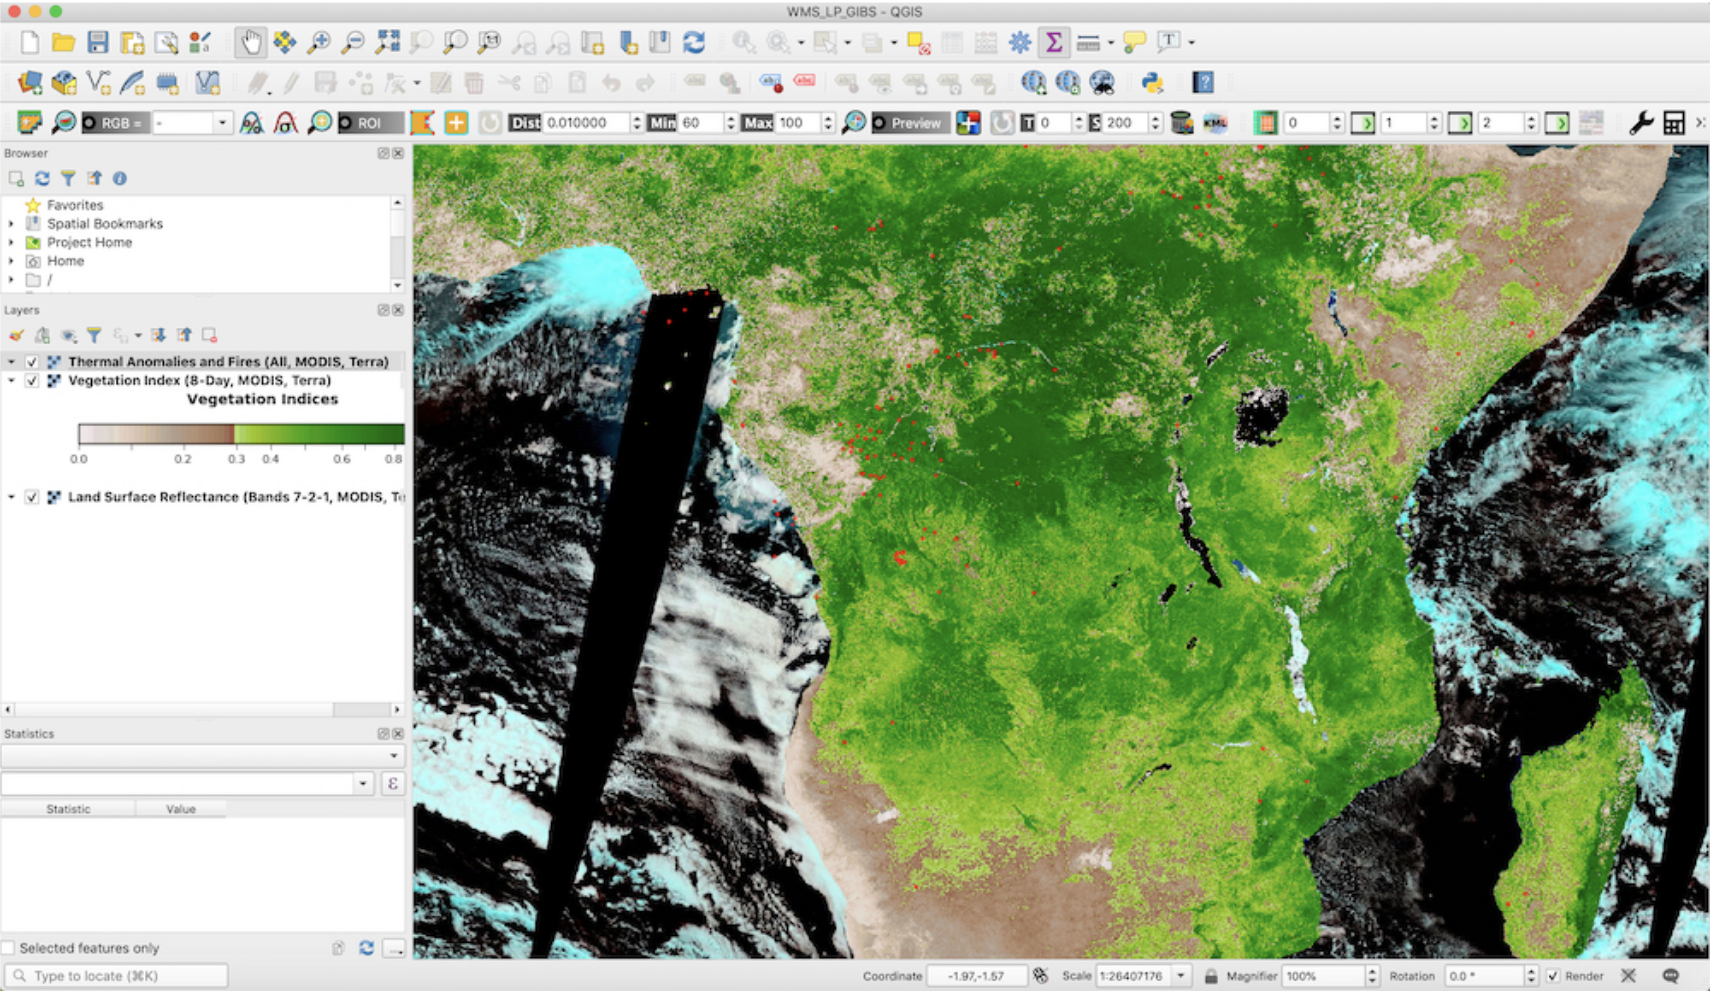
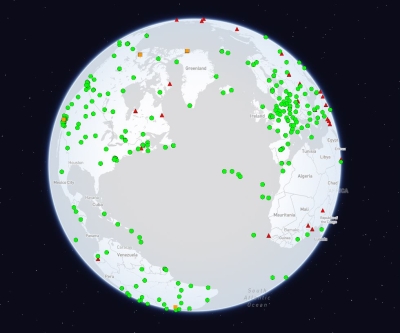
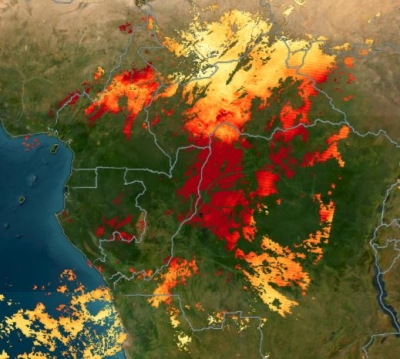
Globally, fire activity changes along the productivity/aridity gradient. This relation should be driven by differing relative roles of the main fire drivers (weather and fuel) along the productivity gradient. In moist regions, fire activity is believed to be driven by drought frequency; in dry regions, fire is thought to be limited by the amount of fuel available.
You can test these ideas by comparing global fire activity. Using the GIBS WMS within a GIS, you can directly access Moderate Resolution Imaging Spectroradiometer (MODIS) land surface reflectance (Bands 7-2-1) data (which helps distinguish burn scars from naturally low vegetation or bare soil), fire and thermal anomalies data, and normalized difference vegetation index data.
2. In this example, the following layers from GIBS were added:
Thermal Anomalies and Fires (All (day/night)) from the MODIS instrument aboard NASA's Terra satellite, Terra/MODIS 8-day Vegetation Index, Terra/MODIS Land Surface Reflectance (Bands 7-2-1).
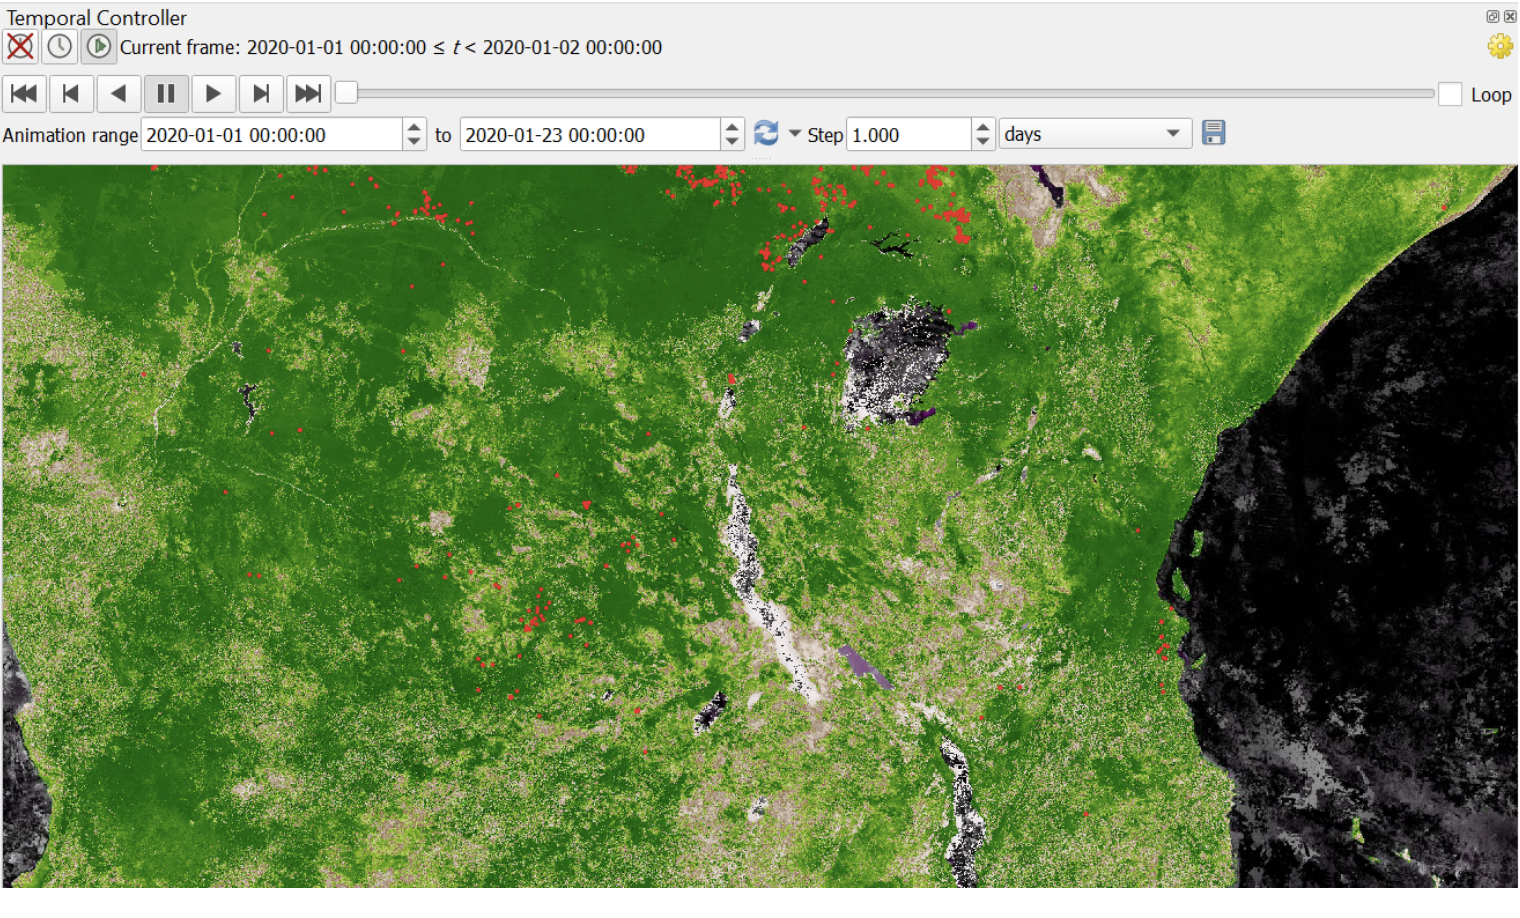
3. Many of the imagery visualization layers provided through GIBS are time-varying imagery layers, and the date/time can be changed directly through some GIS applications using the temporal controller or time slider functionality. GIBS provides instructions for enabling this capability, with a fixed temporal range or an animated one, within several GIS applications.
Web coverage Service
Web Coverage Service (WCS) – SEDAC
Approximately half the original wetland habitats in the U.S. have been lost over the past 200 years. While part of this loss is the result of natural evolutionary processes, human activities (such as dredging wetlands for canals or draining and filling wetlands for agriculture, grazing, or development) are responsible for a large contribution to marsh habitat alteration and destruction. Wetlands in the U.S. state of Louisiana represent about 40% of the wetlands in the continental U.S.; however, they account for about 80% of U.S. wetland losses (from Louisiana Coastal Wetlands: A Resource at Risk).
Concerned about a changing climate, you conduct an analysis of coastal wetland loss from sea level rise using estimates of wetland losses as a basis for identifying potential adaptation measures. Through SEDAC's WCS, you can directly access elevation data, population density, and an urban extent grid within a GIS.
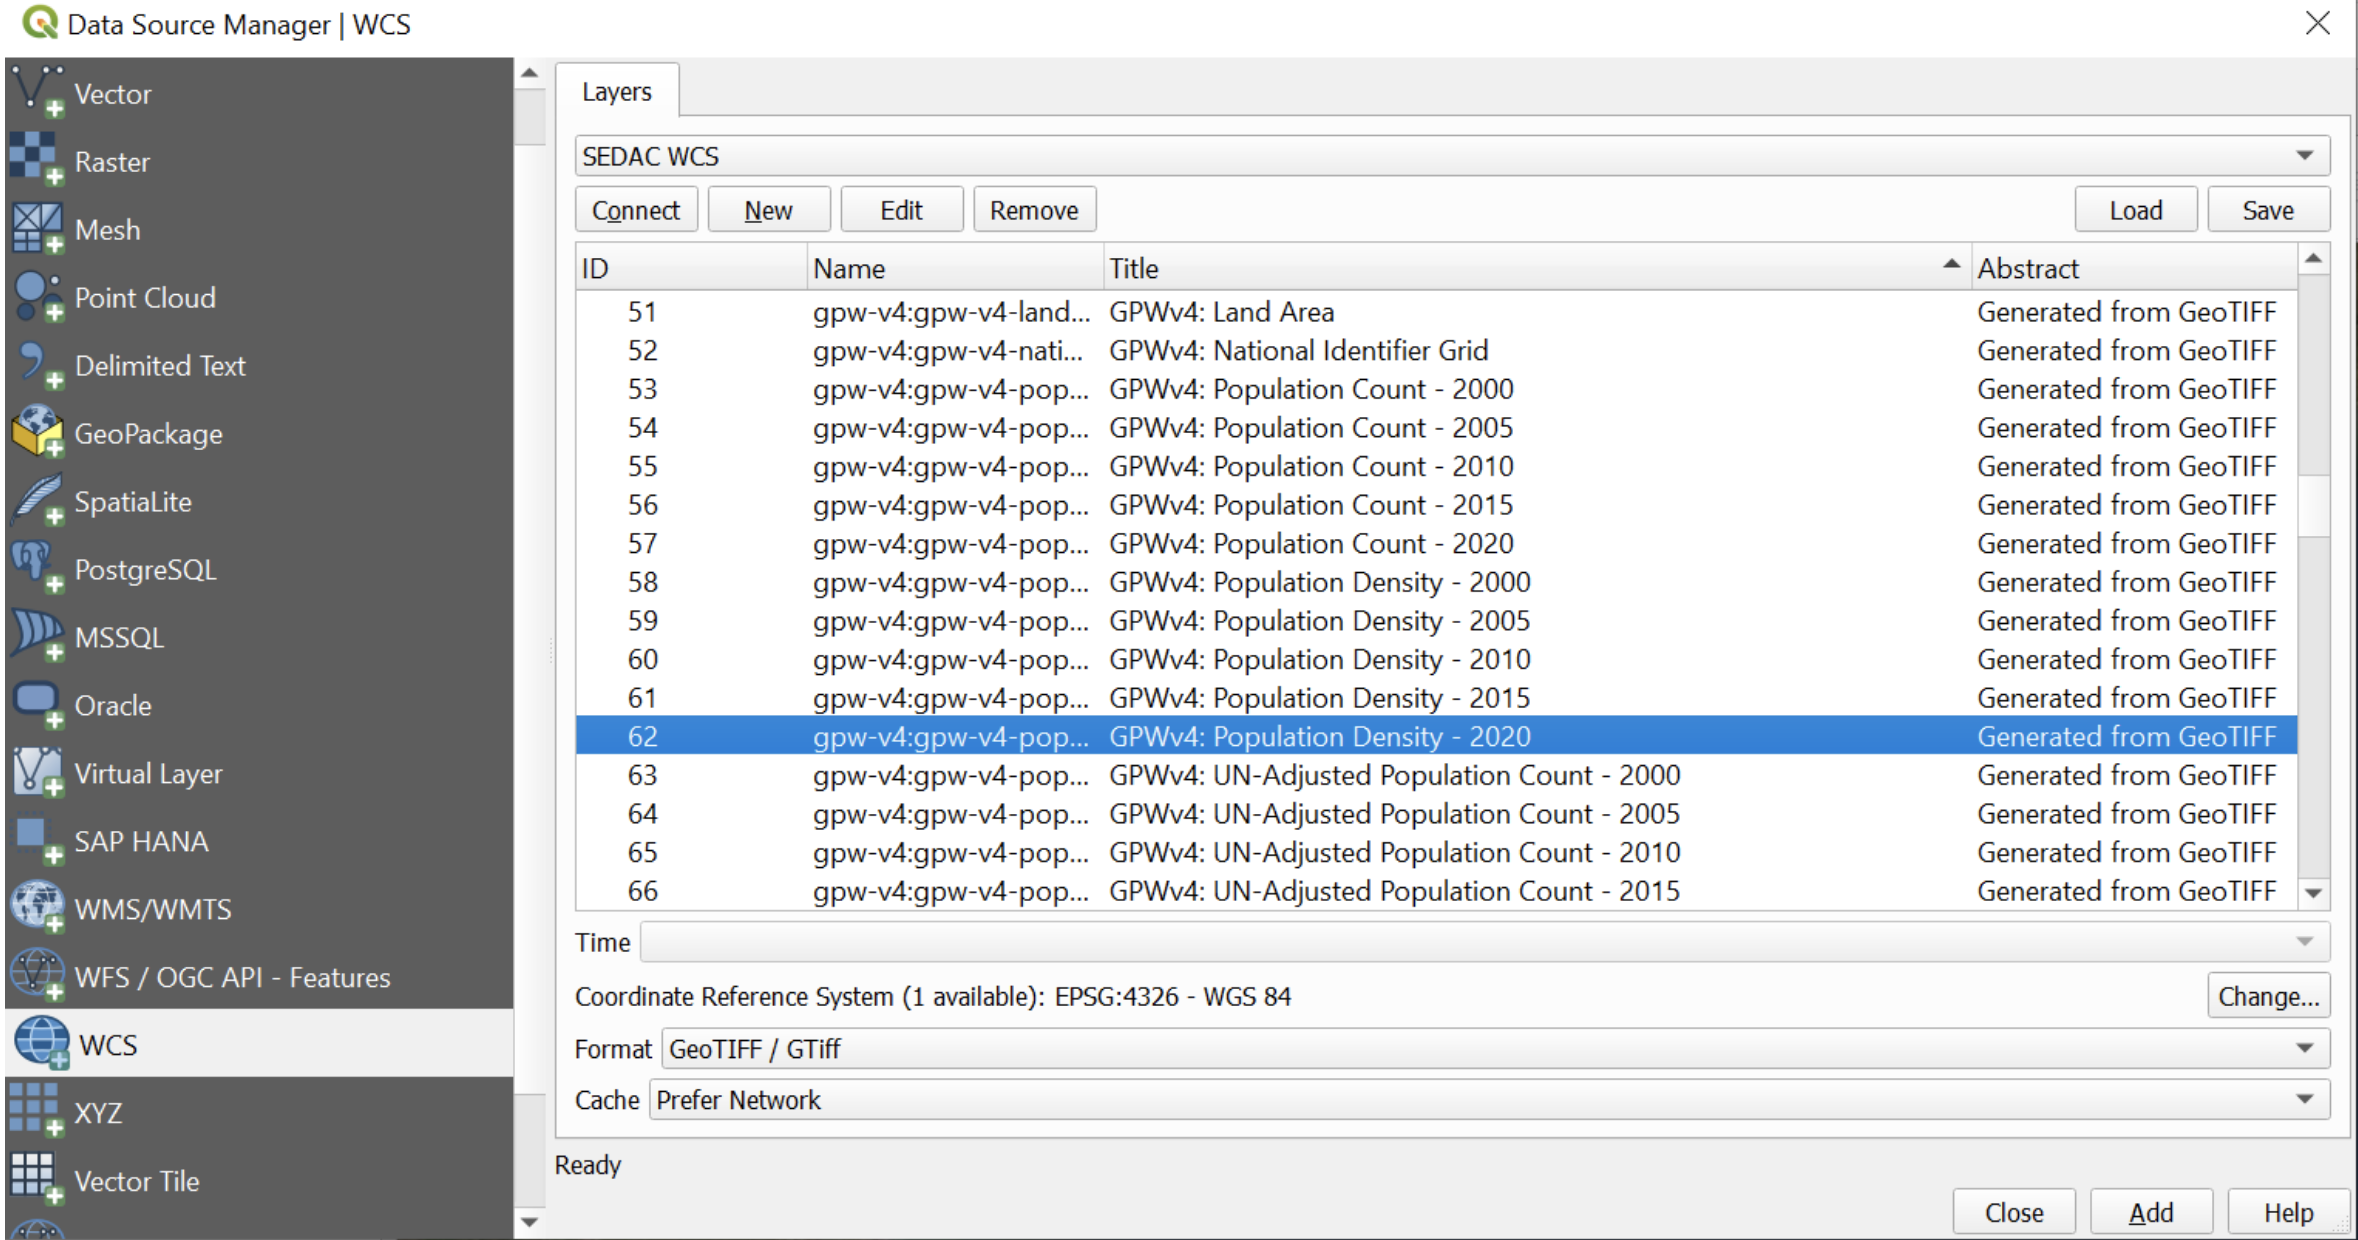
To add a WCS:
1. Proceed to Layer and "Add a WCS Layer."
2. Provide a name and insert this URL: https://sedac.ciesin.columbia.edu/geoserver/wcs?
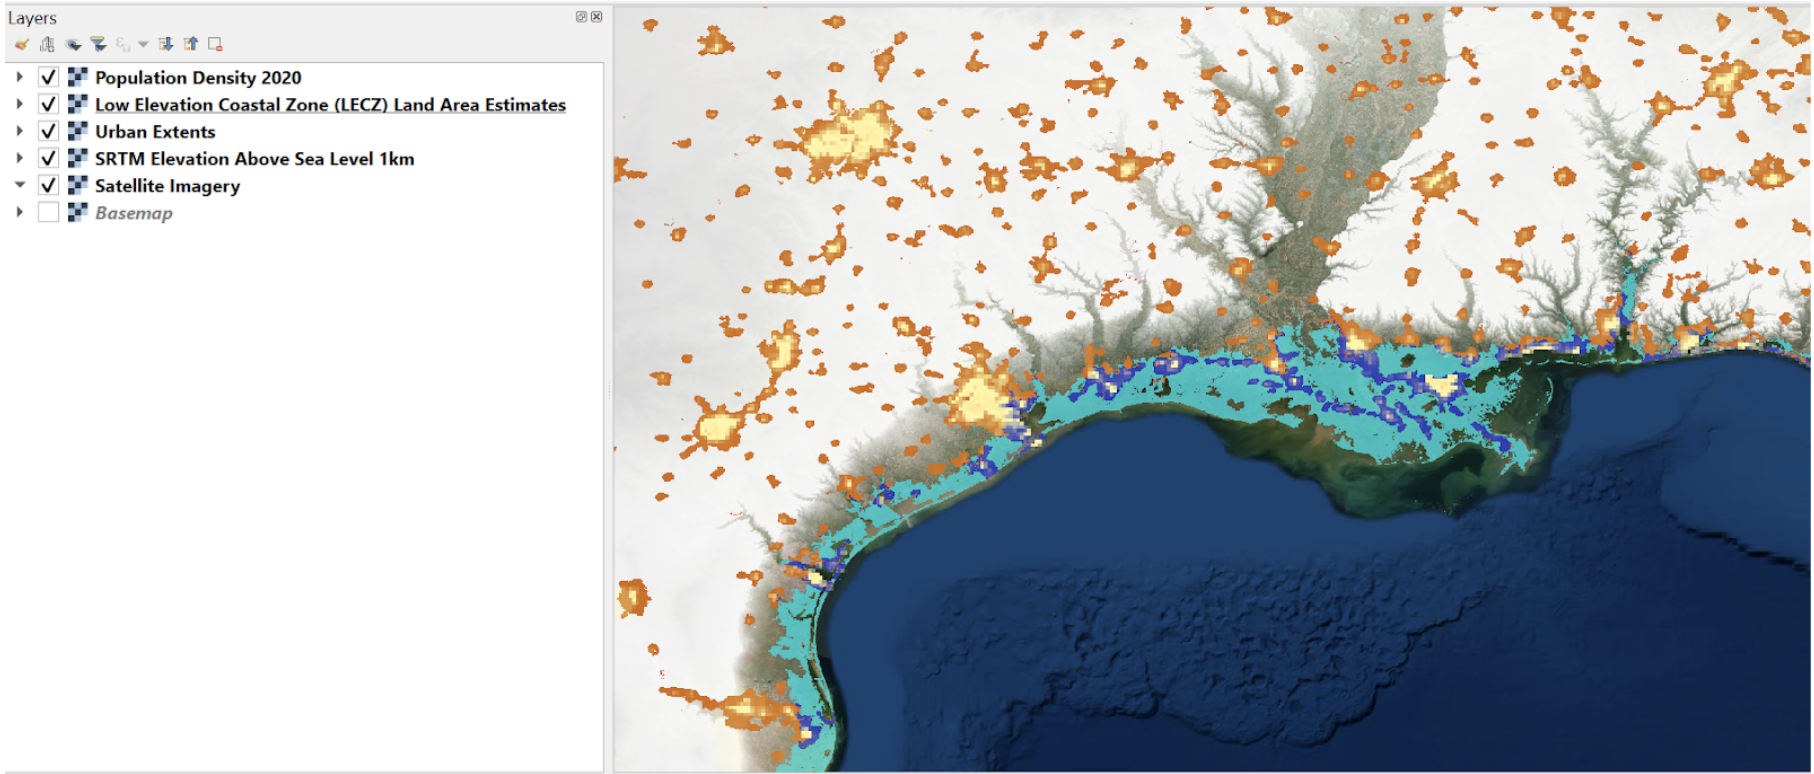
3. In this example, the following SEDAC layers were added:
Global Population of the World, population density for 2020, Low Elevation Coastal Zone areas, Urban Extents, and the Global Shuttle Radar Topography Mission (SRTM) Elevation above Sea-level at 1 km resolution
4. Click "OK", then click "Connect." Imagery layers can now be added to the map viewer.
5. WCS allow users to adjust symbology and retrieve data values, providing more value beyond a static image.
Web Coverage Service (WCS) - from NASA's Oak Ridge National Laboratory DAAC (ORNL DAAC)
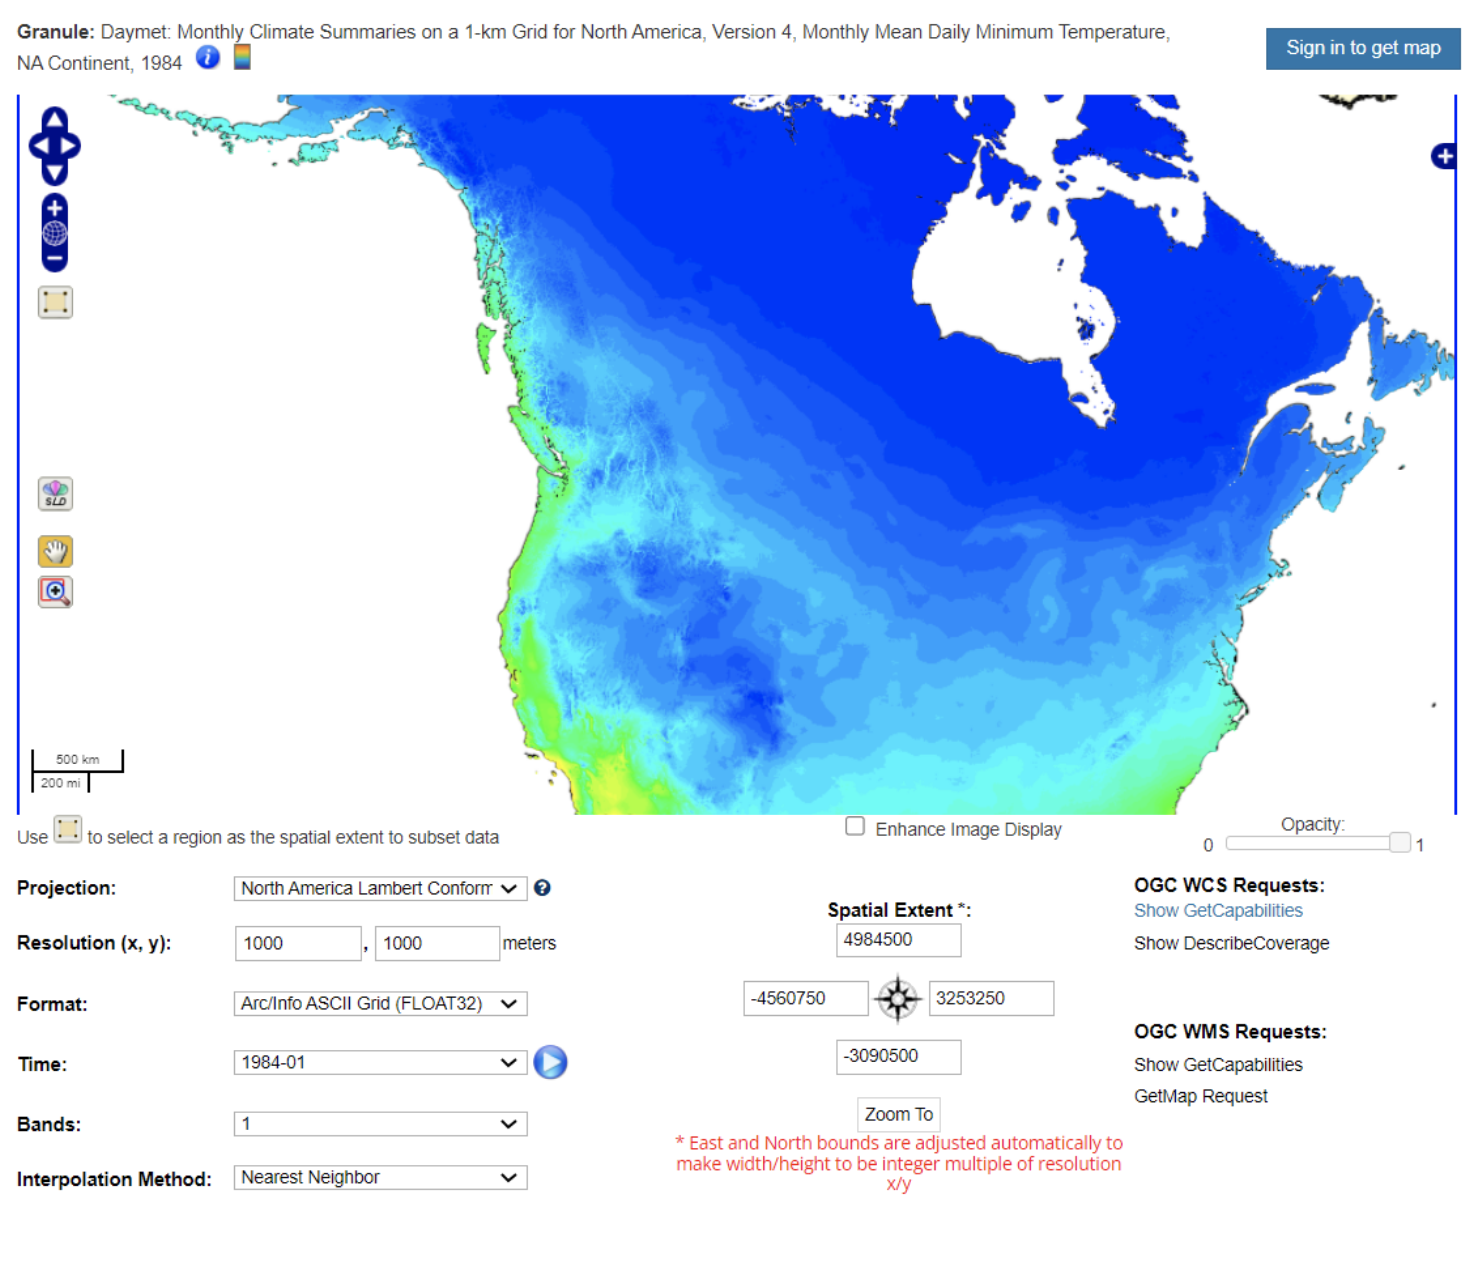
According to NOAA'S Global Annual Temperature Rankings Outlook, the year 2020 was on track to be one of the warmest on record. Concerned about a changing climate, you want to access climatological data and generate an anomaly map for the month of January 2020. ORNL DAAC Spatial Data Access Tool (SDAT) has an interactive interface which provides access to various geospatial data, including OGC web services allow users to select the spatial extent, format, projection and resolution of the data to be previewed and/or downloaded.
Through ORNL DAAC's WCS, you can directly access a data product called Daymet. Daymet is a collection of gridded estimates of daily weather parameters generated by interpolation and extrapolation from daily meteorological observations. Daymet data can be used to run raster-based functions to generate a 28-year time averaged map and then an anomaly map for 2020.
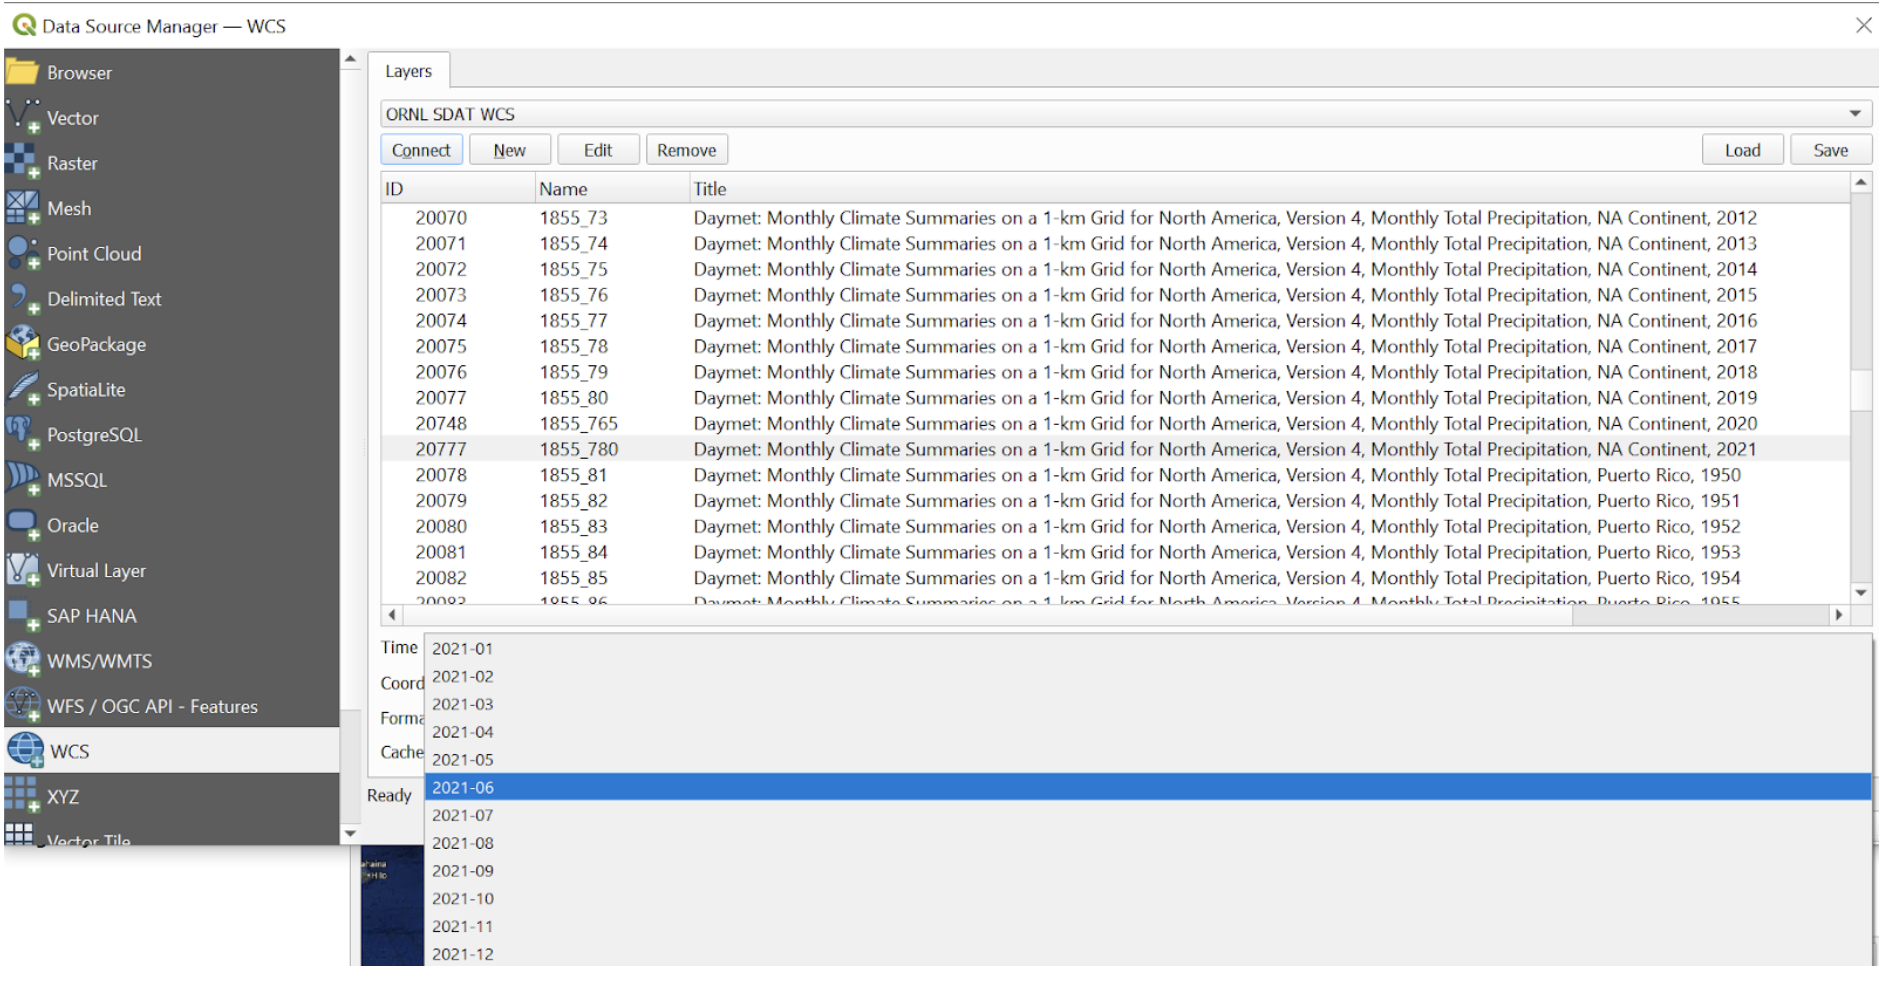
2. Click "OK", then click "Connect." Coverages can now be added to the map viewer. Users can identify time slices available by selecting the options under “Time”.
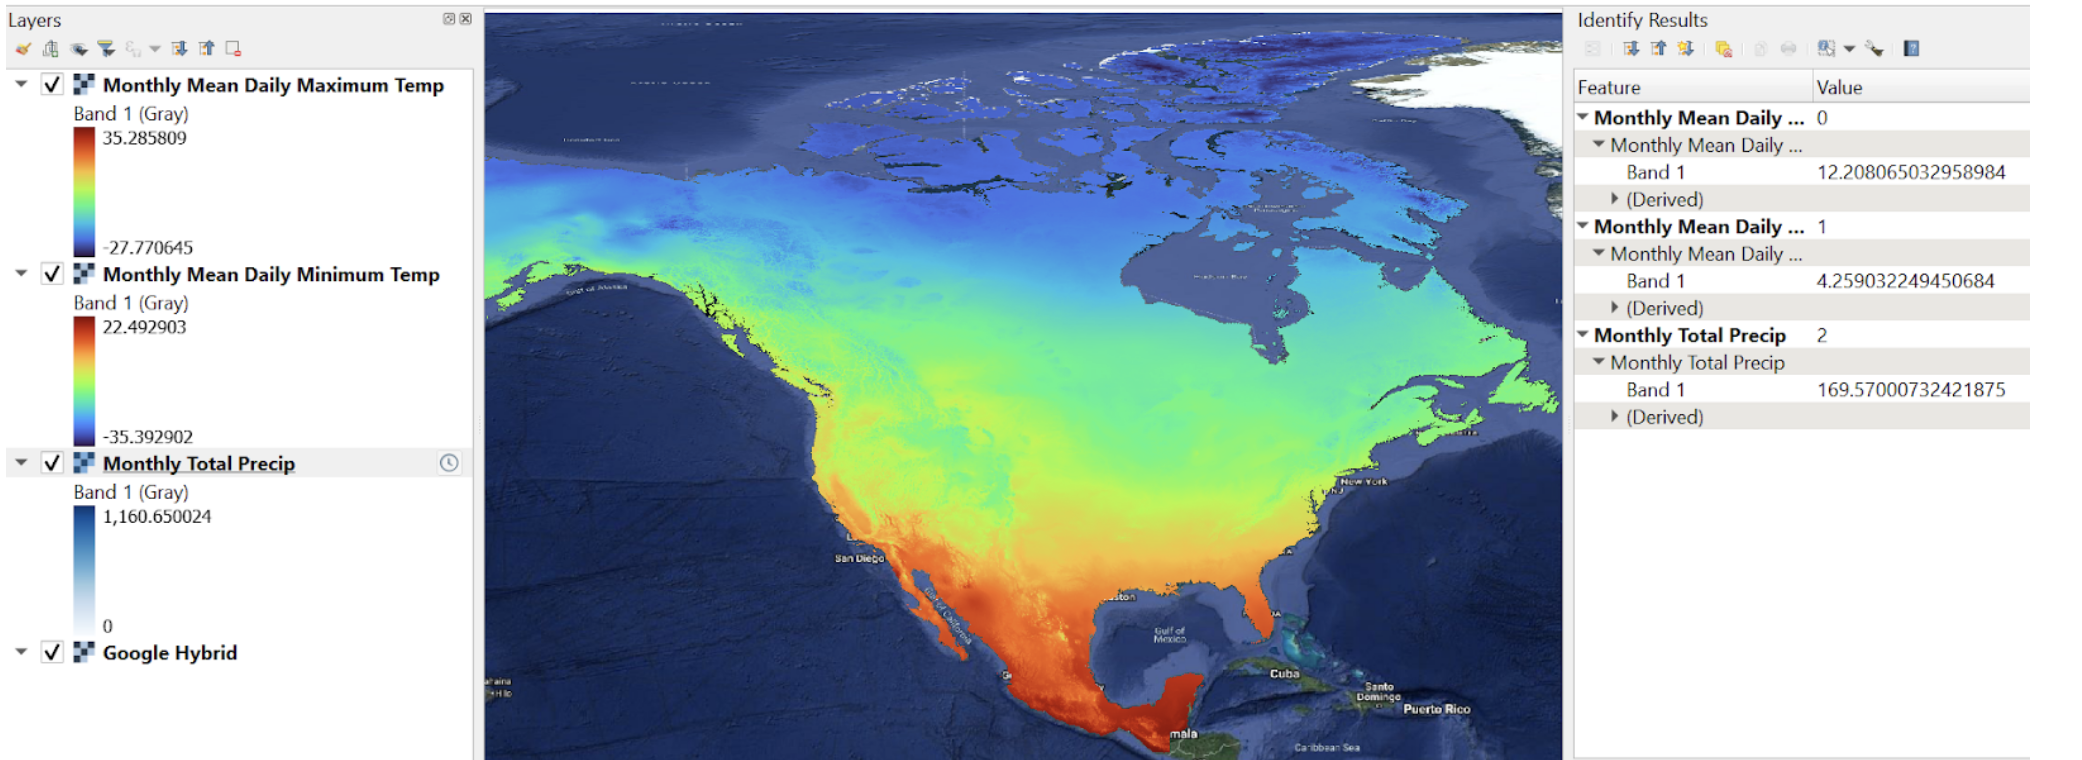
3. In this example, the following ORNL DAAC layers were added:
Daymet: Monthly Climate Summaries on a 1-km Grid for North America in 2021: Total Precipitation, Monthly Mean Daily Minimum Temperature, and Monthly Mean Daily Maximum Temperature
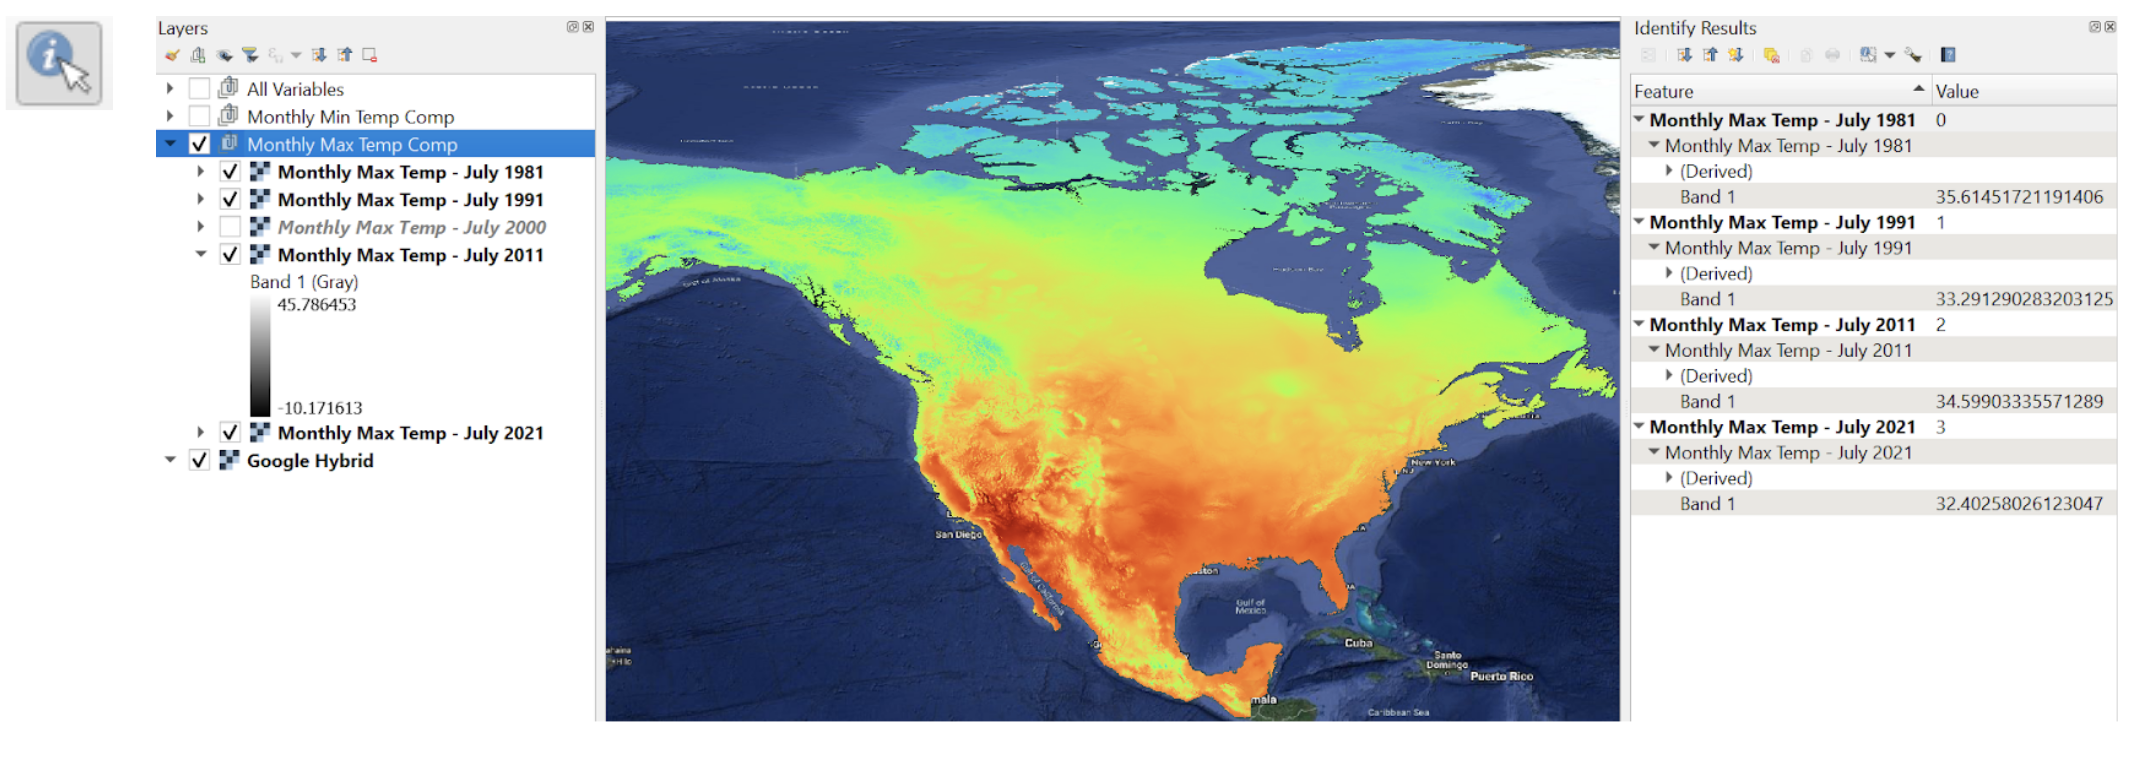
4. Then comparing solely Daily Maximum Temperature over 40 years. Using the identify tool you can point and click on a location to retrieve data values. Note: these temperature values are represented in units Celsius.
Image Service
Hurricane and Infrastructure Use Case in ArcGIS Pro
This use case focuses on Hurricane Ida, which occurred in August 2021. Hurricane Ida was a deadly and destructive Category 4 Atlantic hurricane that became the second-most damaging hurricane to make landfall in the U.S. state of Louisiana.
The demonstration below uses ArcGIS Pro and an ArcGIS Image Service derived from NASA's Integrated Multi-satellite Retrievals for Global Precipitation Measurement (IMERG) early dataset. This service estimates precipitation rate from multiple sensors and incorporates calibrations from climatological rain gauges.
To add the Image Service:
1. Locate the endpoint found from the public content item page. This page can be found searching NASA’s ArcGIS Online (AGOL) or the Living Atlas of the World repository of global GIS content.
Image
2. From here you can choose to Open in the tool of your choice, in this case ArcGIS Pro, or copy the endpoint directly:
*Note: An ArcGIS Image Connector plugin is available for QGIS. ArcGIS Image Services can also be connected to as a REST service and may have OGC WMS and WCS endpoints available.
3. The next step is to connect to the ArcGIS Image Service:
Open ArcGIS Pro* → Add Data → Data from Path using the URL copied above.
Once added, the data will be visualized on the map
4. Zoom to the area of interest, in this case the U.S. Gulf of Mexico, specifically targeting the state of Louisiana.
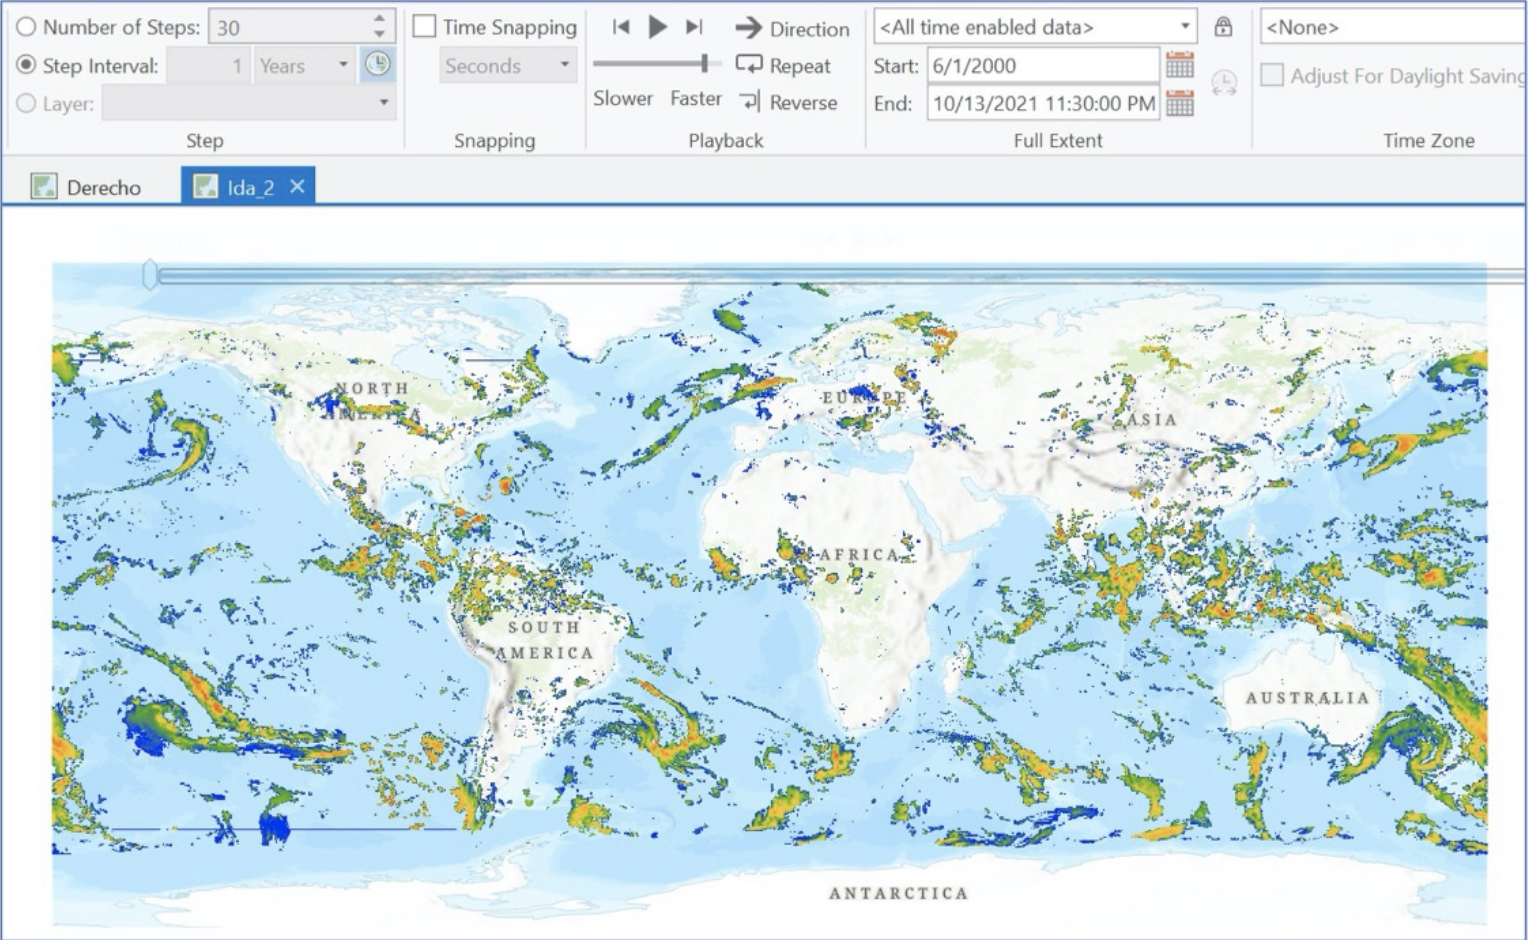
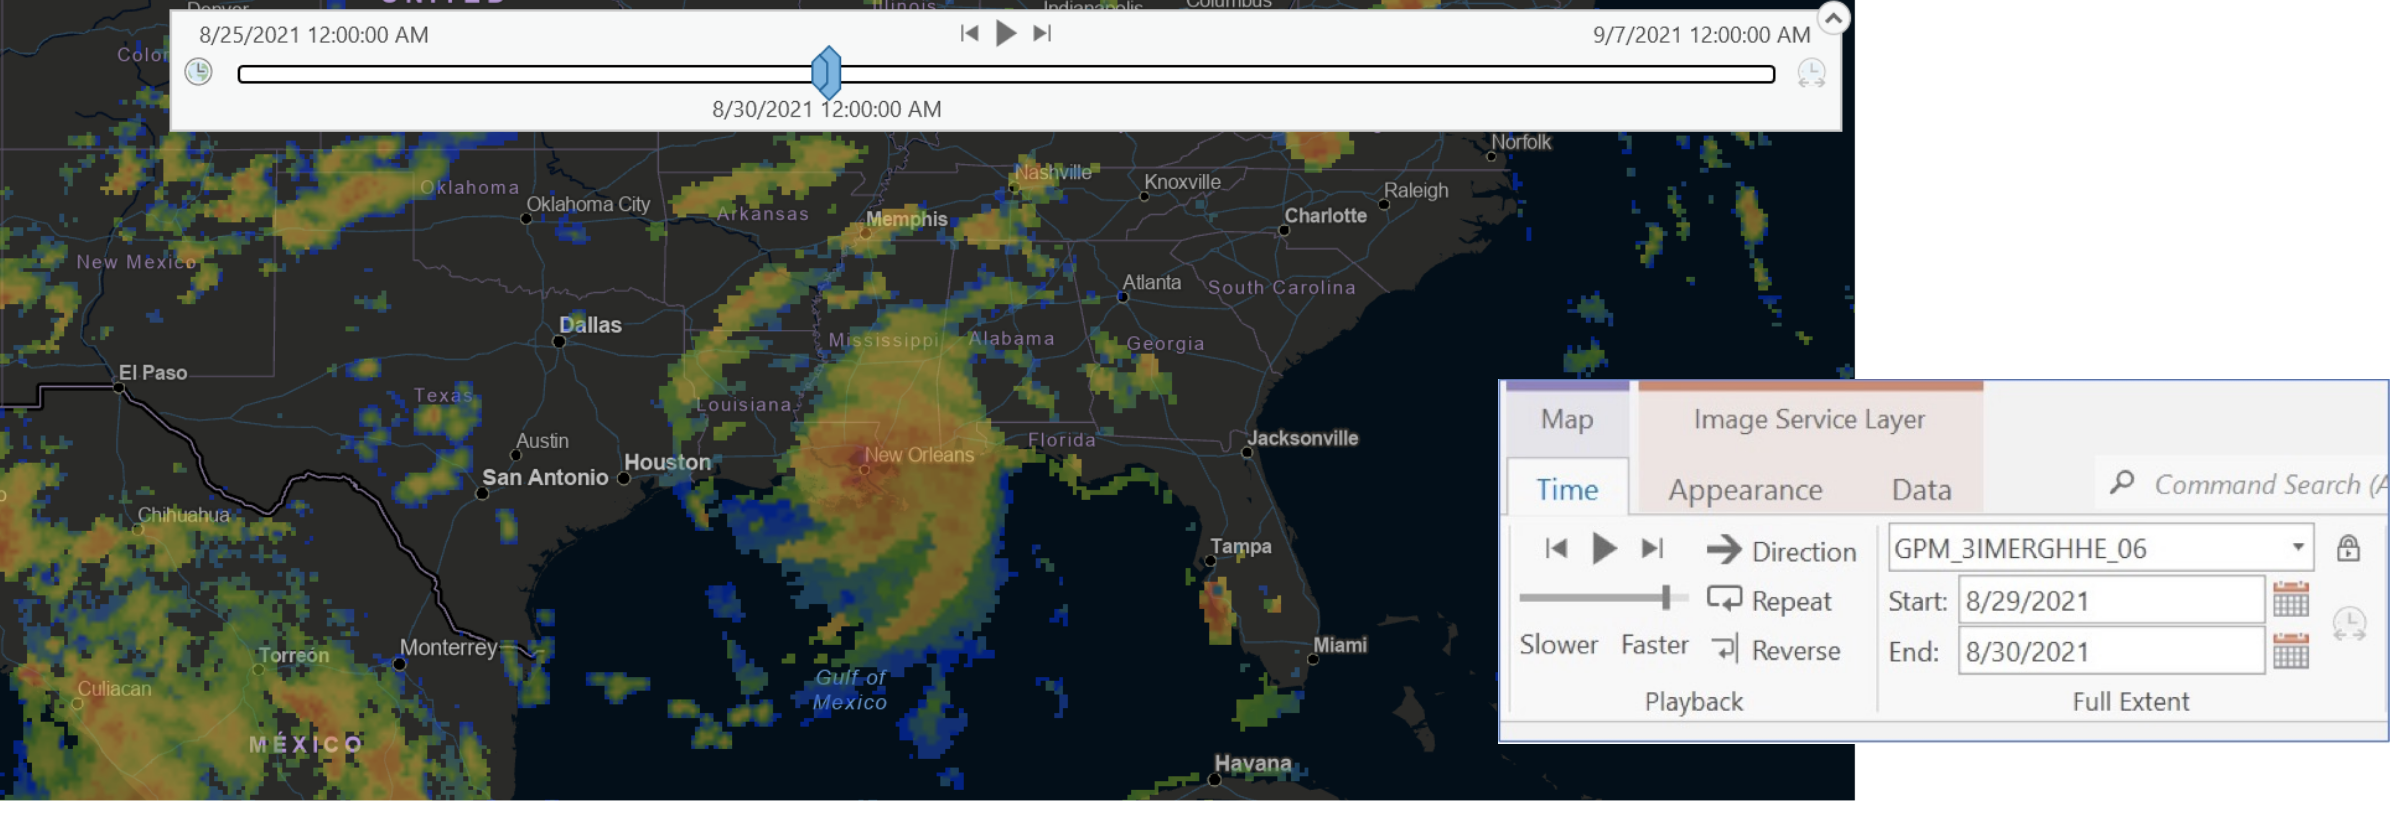
5. The image service provides global coverage with temporal span from 06/01/2000 0:00 GMT to present at 30-minute intervals. Focusing on Hurricane Ida, we want to specify the timeframe we are interested in so the service only displays the data from this event:
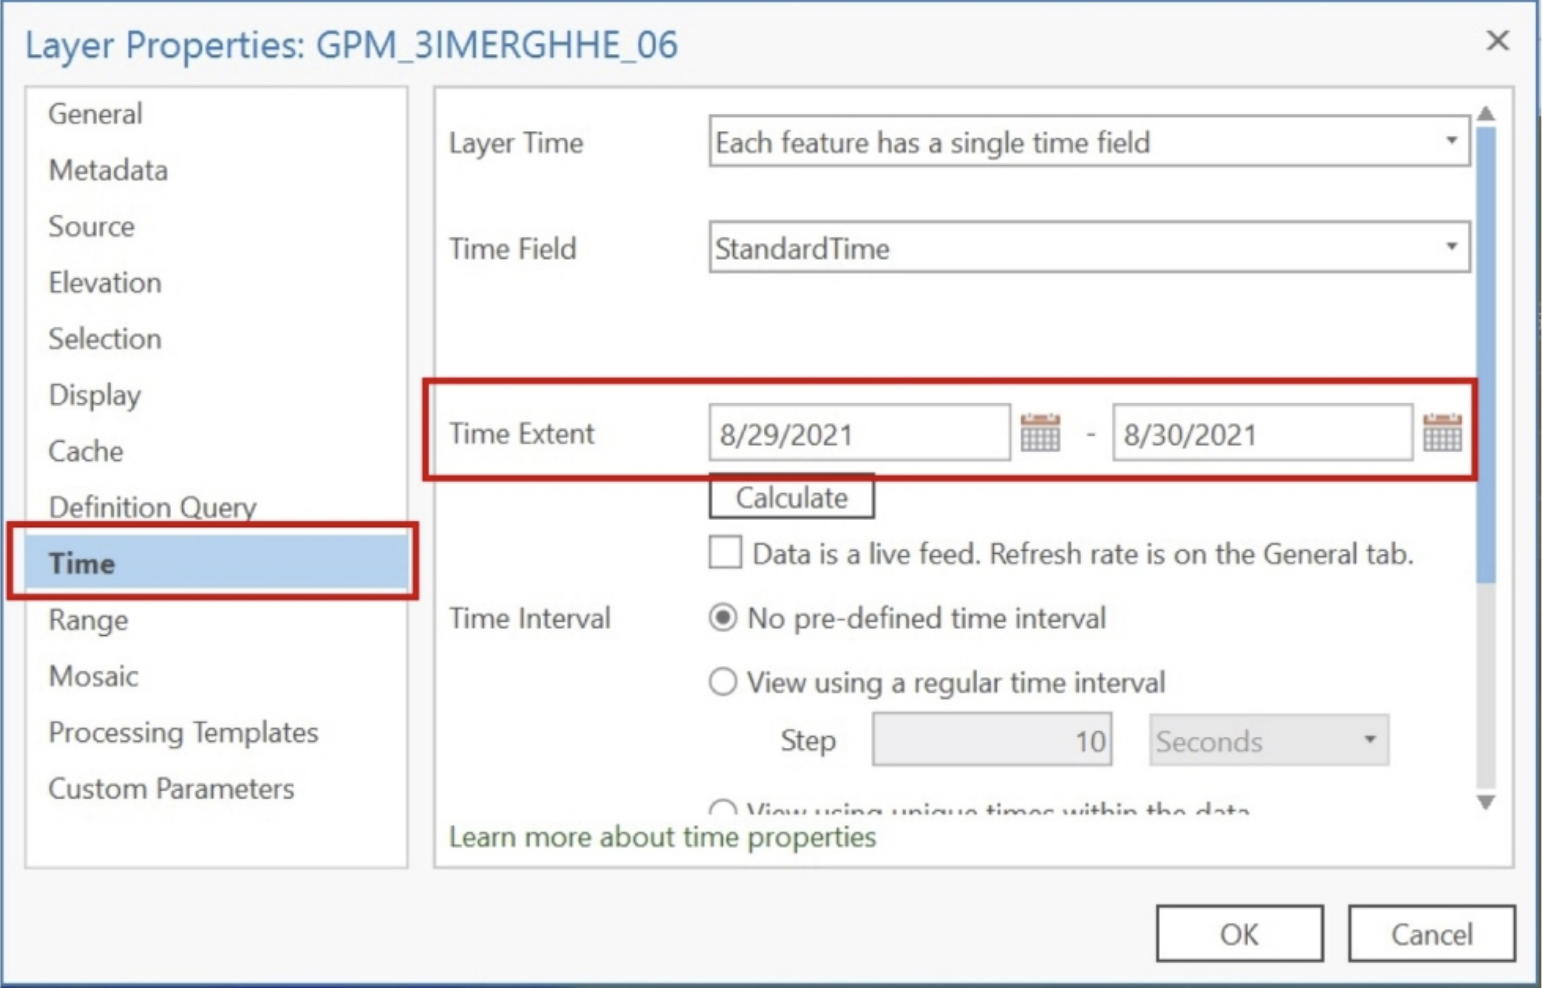
6. Open the service Layer Properties from the Content menu. Select Time to establish the Time Extent, in this case: August 29-30, 2021.
7. This will be displayed on the map where you can play through the time series and watch the storm make landfall.
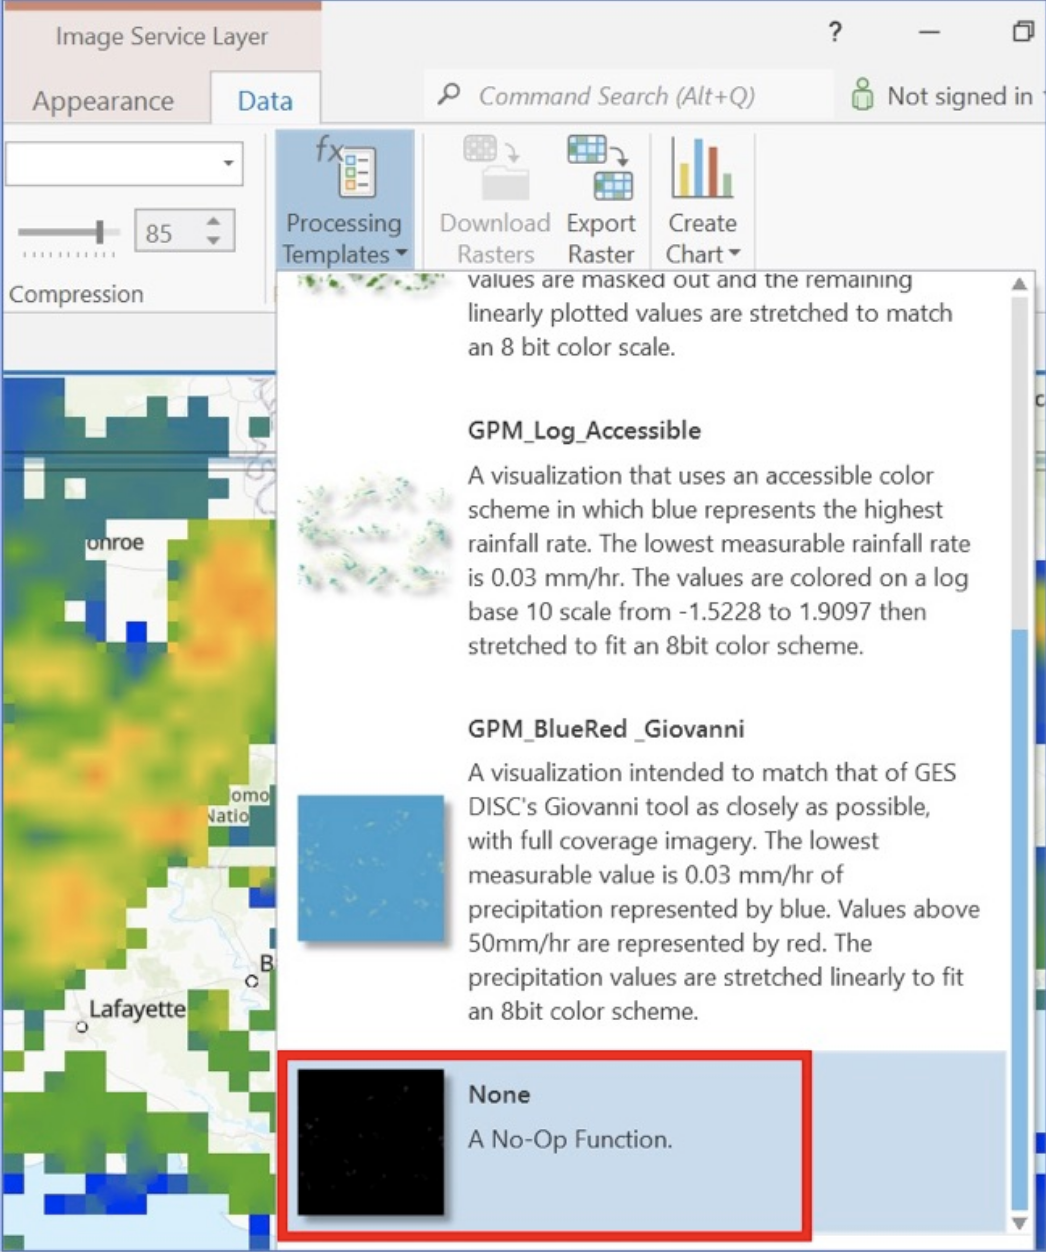
8. To adjust data values and displays, you can adjust or remove the Processing Templates found in the Image Service Layer tab.
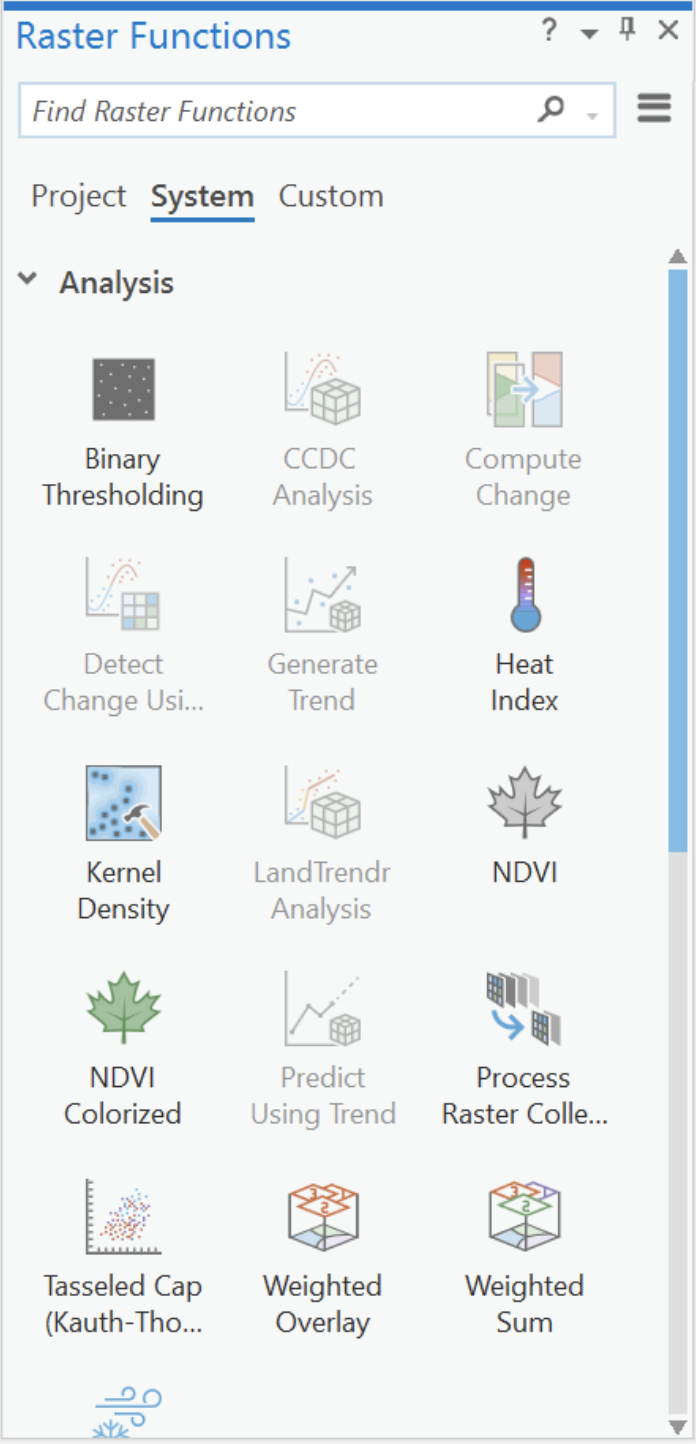
9. Using this image service, you can open and employ a variety of Raster Functions that are performed against the service itself. These can be found in the Analysis tab.
Examples include:
Unit Conversion to convert the original Millimeters per Hour to Inches per Hour Clip to set the extent of the data to only use what is displayed in our current map extent
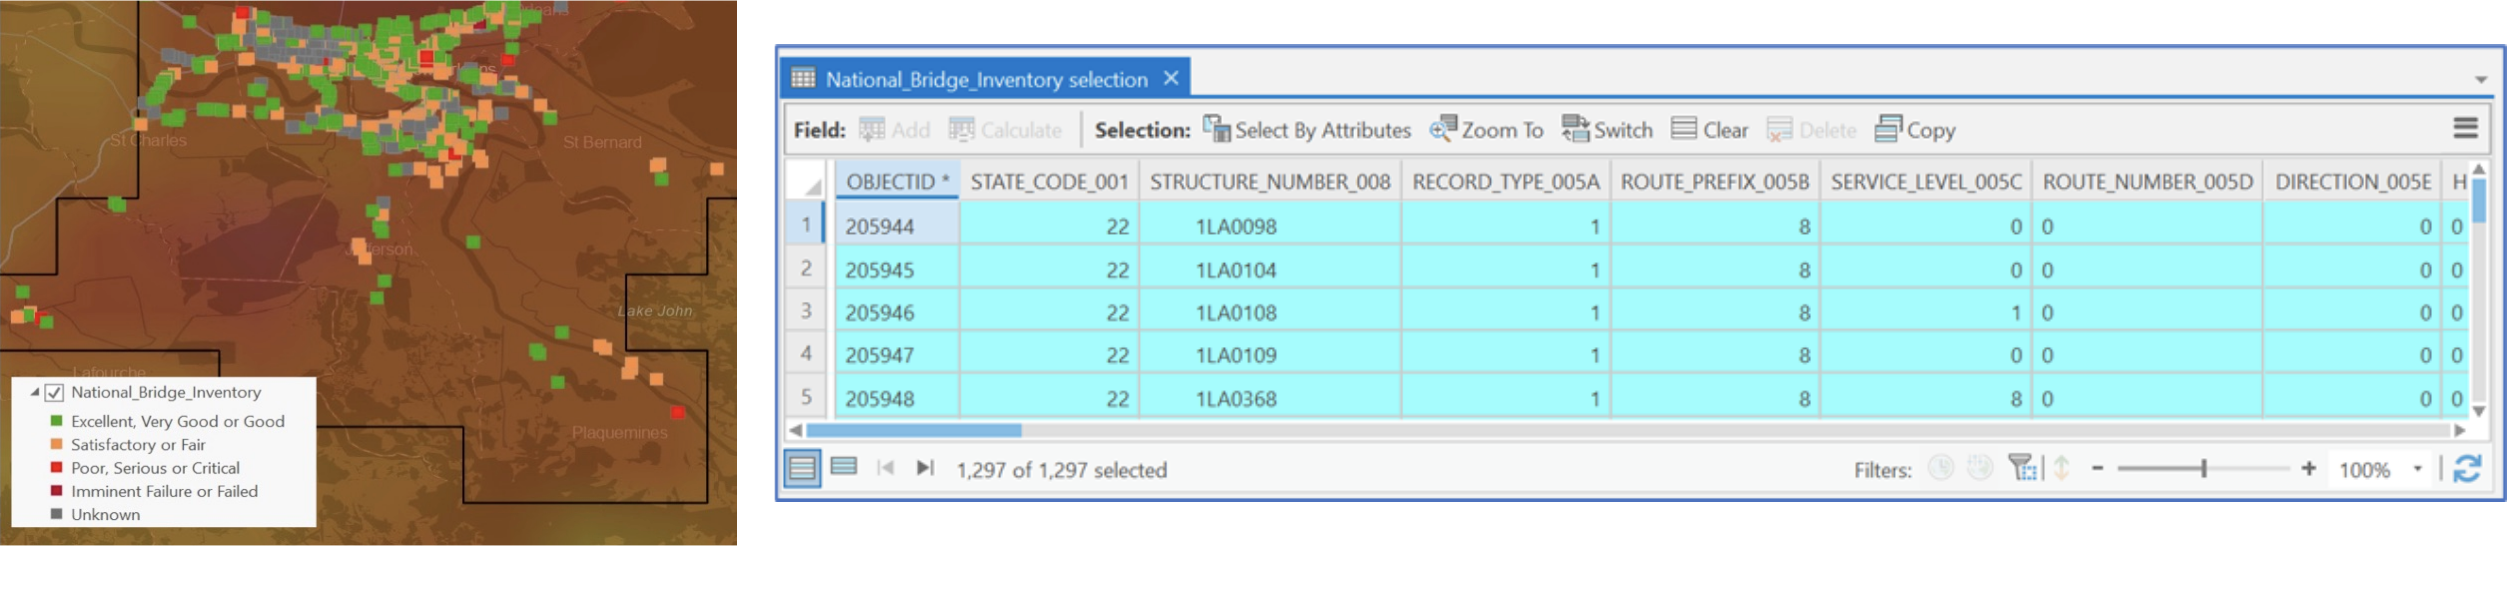
Using these outputs, you can extract values, adjust symbology, convert to polygon, and integrate other data to visualize and analyze relationships, patterns, and impacts.
In this demonstration:
Add Data → Data. Under the Portal section, click to access Living Atlas. Search "bridges" and find the National Bridge Inventory. Add it to our map to identify critical infrastructure that is at risk from this storm.
Air Quality Use Case in ArcGIS Pro
This use case will leverage content made available through the enterprise Earthdata GIS (EGIS) portal: https://gis.earthdata.nasa.gov/portal/home/. This portal provides free and open access to various GIS-ready content, including applications, web maps, and image services.
Within ArcGIS Pro, navigate to the Catalog Pane and open the gis.earthdata.nasa.gov server (see the Visualization subsection of the ArcGIS Pro section for instructions if the server has not yet been added).
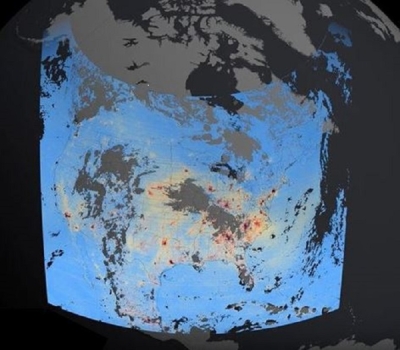
Acquire the Population Density layer from the gpw-v4 folder, the PM2.5 layer from the sdei folder, and the Monthly Radiation layer from the POWER folder, specifically ensuring AOD_55_ADJ, or (Adjusted Aerosol Optical Depth 55 parameter is added.
Image
Adjust transparency and symbology (optional) to better visualize data. Using the Time tab, modify the temporal attributes to be more closely aligned with the one month intervals. Select a time period and area of interest and select the play button on the time slider interface to observe data through those time slices. For example, AOD is observed in the western United States as a result of the numerous wildfires in Fall of 2020. AOD is defined as the optical thickness at 0.55 um measured vertically; the component of the atmosphere to quantify the removal of radiant energy from an incident beam.
Image
To get a better understanding of this data relative to annual means and trends, open the Multidimensional tab in the Image Service Layer group after bringing in the POWER Monthly Radiation Image Service. Select the Temporal Profile capability. Configure the tool as needed - in this example, we assess the AOD over the San Francisco area over twenty years to see if the high values observed in 2020 are abnormally high. Additional raster functions and analyses can be completed using the image service as an input given the underlying data is available.
Image
Visit the Earthdata YouTube GIS playlist to access the following tutorials related to related to using Image Services in various tools:
Check out our GIS page to Discover GIS Content, Explore the Imagery, and Access the Data
Visit the numerous GIS Tutorials/How-Tos and Data Recipes provides tips for transforming data for GIS use.
The Application for Extracting and Exploring Analysis Ready Samples (AρρEEARS) offers a simple and efficient way to access and transform geospatial data from a variety of federal data archives. AρρEEARS enables users to subset geospatial datasets using spatial, temporal, and band/layer parameters. Two types of sample requests are available: point samples for geographic coordinates and area samples for spatial areas via vector polygons.
If you are interested in receiving expert advice, check out the Earthdata Forum, where subject matter experts from NASA data centers are available to discuss general questions, research needs, and data applications (within the “Search by Tags” box, under “Services/Usage” select “GIS Tools” from the dropdown).
While all NASA Earth science data are available without restriction, an Earthdata Login is required to download data and access some resources (including some resources noted in this Data Pathfinder). If you do not already have an Earthdata Login, you can set one up quickly and easily through the Earthdata Login page.