For the past five years, Drew Rothrock, Principal Research Scientist at the University of Washington's Applied Physics Laboratory, has been studying measurements of sea ice draft (sea ice thickness below the water surface) in the Arctic Ocean. Rothrock and colleagues compared sea ice draft data collected on U.S. Navy submarine cruises between 1993 and 1997 with data collected on cruises in the same region between 1958 and 1976. Since changes in sea ice correspond to climate change patterns, Rothrock said he had expected to find that the ice had thinned by maybe 45 to 50 centimeters (18 to 20 inches), but he found that mean ice draft at the end of the melt season in most of the deep-water portion of the Arctic Ocean had actually decreased by about 1.3 meters (3.5 feet).

Although the U.S. Navy has collected ice data for decades, it has only allowed their use in research since the end of the Cold War. Many of the submarine sonar data on sea ice draft collected in the 1990s were acquired through the Scientific Ice Expeditions (SCICEX) program. Because these data cover most of the deep Arctic Ocean basin, they enabled an analysis of variations in ice draft over a much broader region than was previously possible.
First, Rothrock and his co-workers looked at the data from three SCICEX cruises. These data, available from NASA's National Snow and Ice Data Center Distributed Active Archive Center (NSIDC DAAC), showed a perennial ice cover with drafts of between 1 and 3 meters, a considerably thinner layer than prior studies had shown. Next, he segmented the data into two groups, based on the period during which they were collected. He limited his comparison to data collected in summer and autumn on the early cruises (1958 to 1976), since the SCICEX data are from the end of summer. Next, he identified 29 points where the earlier submarine tracks either crossed or were closely parallel to the 1990s cruise tracks.
Rothrock's comparison showed that the sea ice thickness had decreased from 3.1 meters (10.2 feet) in 1958 to 1976 to 1.8 meters (5.9 feet) in the 1990s. "This is not a case of thicker ice appearing in one region simultaneously with thinner ice appearing in another, induced perhaps by a change in surface winds and ice advection," Rothrock said. "This represents a widespread decrease in ice draft within the central Arctic Ocean, with the strongest decrease occurring in the eastern Arctic." In addition to the ice cover being thinner than it was between 1958 and 1976, the SCICEX data indicate that ice has continued to thin in some regions throughout the 1990s, at a rate of about 0.1 meter per year.

At first glance, Rothrock's findings might provoke images of rising sea levels and ensuing coastal flooding. But sea ice is quite different from ice that forms glaciers and ice sheets on land. Sea ice, which seldom gets much thicker than about 10 meters (32.8 feet), begins to form when the sea surface cools to the freezing point of sea water at about minus 2 degrees Celsius. Since it is already floating and has already displaced water in proportion to its weight, sea ice doesn't cause sea level to rise when it melts. By contrast, when land ice breaks off and slides into the ocean or melts and flows into the ocean as liquid water, sea level rises.

Arctic sea ice cover is an essential ingredient of the Earth's climate system; ocean currents can influence climate by redistributing heat, especially in coastal regions. Scientists fear that continued melting of sea ice could weaken the North Atlantic Current, the northward continuation of the Gulf Stream. The Gulf Stream transports 25 times more water than all the Earth's rivers, and a diversion could result in extremely cold winters in the North Atlantic regions, especially in northern Europe.
The possible effects of continued sea ice thinning don't end with impacts to regional climate, however. According to Claire Parkinson, climatologist at NASA's Goddard Space Flight Center, sea ice has a major influence on Arctic ecosystems, affecting animal species that depend on sea ice as a platform for resting, foraging, social interaction and breeding. "Concern has been raised that if the trends toward shortened sea ice seasons and lesser sea ice coverage continue, this could entail major consequences to the polar and perhaps global climate, and to the lifestyles and survivability of selected Arctic plant and animal species," Parkinson reported to those attending a U.S. Global Change Research Program (USGCRP) seminar in February 2000.
What is causing these dramatic changes in sea ice thickness? Rothrock said he doesn't have a definitive answer, and he is cautious about how he frames his findings. "Whether a change of the observed magnitude in ice thickness over several decades is part of a natural cycle of climate variability, or represents a mix of human influences on the climate system and natural climate variability, is presently unknown from the perspective of these observations alone," he said.

According to Rothrock, sea ice thinning could be related to changes in atmospheric temperatures and conditions, such as precipitation and snow cover, or in the amount of heat supplied to the ice by the ocean. The most probable cause that Rothrock cited is the strong North Atlantic Oscillation index that occurred in the late 1980s and early 1990s. The NAO is a fluctuation in the difference between the high atmospheric pressures occurring in the subtropics near the Azores and the low atmospheric pressures occurring near Iceland. This climate oscillation has a major influence on meteorological variables, such as surface wind, temperature, and precipitation, in the North Atlantic Ocean, the Arctic Ocean, and their surrounding landmasses. However, the mechanisms behind the NAO are not clearly understood. (For more information on the NAO, see Searching for Atlantic Rhythms.)

Perhaps the major obstacle that Rothrock and his colleagues are up against in defining a cause for thinning sea ice draft is insufficient data. "There is not yet a good temporal record of ice draft over the Arctic Ocean; what we have constructed here is better thought of as two climatologies, one for 1958 to 1976 and another for 1993 to 1997," said Rothrock.
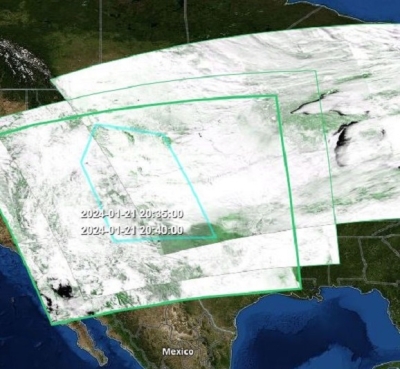
But new satellite imaging techniques could be a boon for scientists studying global climate change. Since 1978, increasingly sophisticated satellite technology has enabled researchers to monitor Arctic sea ice cover on a routine basis.
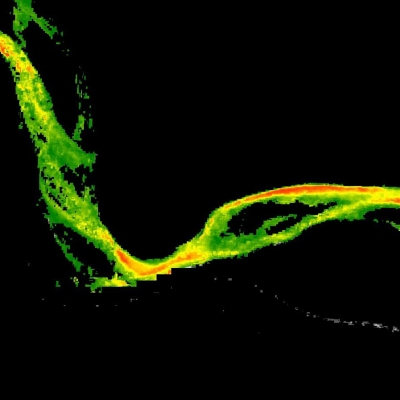
Parkinson and groups at other research centers are using Scanning Multichannel Microwave Radiometer (SMMR) and Special Sensor Microwave Imager (SSM/I) data to examine trends in the length of the sea ice season and in the extent of the Arctic ice. They have found a net decrease in Arctic ice extent of 2.9 percent per decade since 1978.
Mark Anderson, Associate Professor in the Department of Geosciences at the University of Nebraska, and graduate student Sheldon Drobot are using SMMR and SSM/I data to examine the onset of spring melt in the Arctic to detect possible signs of climate changes. "Passive microwave data are ideal for deriving snow melt onset dates, because brightness temperatures change rapidly during melt onset," said Drobot. "By identifying these periods of rapid change in the microwave data, the occurrence and variability of melt onset can be monitored. We're looking for trends, because they will tell us whether a climate signal exists."

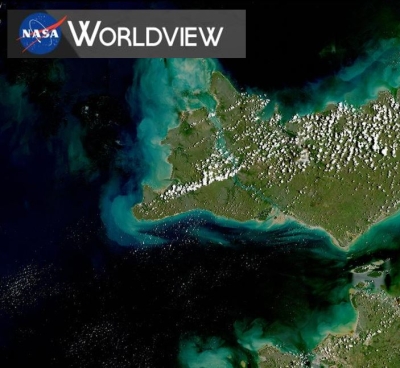
Joan Ramage, a doctoral candidate in the Department of Geological Sciences at Cornell University, is using SSM/I data sets to examine connections between the atmosphere and glacier surface melt in Southeast Alaska. "With satellite methods we can measure snow lines, the boundaries between ice and snow covered areas at the end of the season, which enables us to get estimates of mass balance on regional scales," said Ramage. Another advantage of satellite technology is that it enables researchers to acquire data in remote areas. "It's a question of money, time, safety, and access," Ramage commented. "Glaciers are far away and dangerous places to be."
More comprehensive data might provide specific information to illuminate why Arctic ice is thinning. Because Earth's climate is determined by interactions among the sun, atmosphere, oceans, and lands, it is likely that the answer lies in a conglomeration of factors. Scientists are only beginning to understand the complexities, but Rothrock's findings underscore the need for more research.
"Whether ice volume has reached a minimum in a multi-decadal cycle or will continue the observed decline, this large thinning of the ice cover is a major climatic signal that needs to be accounted for in a successful theory of climate variability," said Rothrock.
References
Rothrock, D.A., Y. Yu, and G.A. Maykut, 1999: Thinning of the Arctic Sea-Ice Cover, Geophysical Research Letters, 26(23), pp. 3469-3472.
For more information
NASA National Snow and Ice Data Center (NSIDC) Distributed Active Archive Center (NSIDC DAAC)
| About the remote sensing data used | ||
|---|---|---|
| Sensor | Scanning Multichannel Microwave Radiometer (SMMR) Special Sensor Microwave Imager (SSM/I) |
|
| Parameter | sea ice thinning | |
| DAAC | NASA National Snow and Ice Data Center Distributed Active Archive Center (NSIDC DAAC) | |