Houston has some of the most polluted air in the United States. The city and the ship channel that leads south to the Gulf of Mexico bustle with industrial activity, producing an unintended byproduct that affects the entire southeastern portion of Texas: air pollution. Currently, Houston and several other urban areas in southeastern Texas do not meet air quality standards established by the United States Environmental Protection Agency (EPA). The state of Texas has conducted several field studies, which revealed the largest pollution sources in the congested southeastern part of the state.
However, officials found that efforts to reduce pollution produced in their cities have not consistently improved air quality.
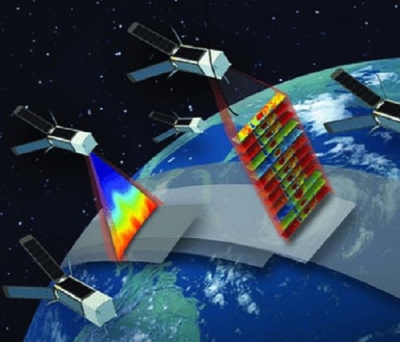
To determine why some cities still fail to meet EPA air quality standards, experts needed more information about how regional and even national pollution might be circulating into Texas. The most recent study, conducted in 2005 and 2006, collected data over the eastern half of the state and included remote sensing data from the Atmospheric Infrared Sounder (AIRS) instrument, flown on the NASA Aqua satellite. Wallace McMillan, an AIRS science team member, said, “We wanted to show the impact that satellites can have on studying air quality in the lowest portion of the atmosphere.” By incorporating satellite data, scientists could observe not only how pollution circulated within the state, but also whether some of the pollution measured in Texas originated farther afield.

Local versus regional
Vehicles, manufacturing plants, and coal-burning facilities emit chemicals that cause air pollution. Some of these chemicals, when combined with sunlight and high temperatures, react in the atmosphere to form ozone, the primary ingredient in urban air pollution. Experts focus on ozone because it is an indicator of overall air quality. Too much ozone can make breathing difficult, aggravate asthma, and cause lung damage. Consequently, the EPA regulates ozone levels, requiring cities to measure ambient levels hourly, averaged over each eight-hour period daily.
The EPA ozone standard is 80 parts per billion (ppb), but because of how measurements are calculated, cities do not violate the standard until ozone levels exceed 84.5 ppb. An extended record of violations can have severe consequences. Mark Estes, a senior air quality scientist with the Texas Commission on Environmental Quality, studies Houston’s air pollution. Estes said, “If the EPA deems that you are not making enough progress, their ultimate penalty is to withdraw your highway funding. That really gets people’s attention.”
Officials are discovering that air pollution is not just a local problem, however. Regional and continental air circulation patterns frequently carry pollution from one area to another. But whether pollution is from a local factory or from another state, cities are expected to meet EPA standards. “If your city has, for example, sixty or sixty-five ppb of ozone blowing in from somewhere else, then the city doesn’t have to produce very much to exceed the standard,” Estes said. “The higher the ambient ozone levels are, the more difficult it is to attain the standard.” The EPA does not allow cities to subtract drifting pollution from their measured ozone levels, meaning that a city like Houston must lower local emissions even further to accommodate pollution that drifts in.

To measure how much pollution was drifting into eastern and southeastern Texas, the state organized the Texas Air Quality Study II (TexAQS II), a collaboration between NASA, the State of Texas, the National Oceanic and Atmospheric Administration (NOAA), and other federal partners. TexAQS II was an eighteen-month study completed in 2006, during which researchers collected data from ground instruments, aircraft, ships, and satellite data. Remote sensing was particularly important for the intensive field study portion, conducted between August and October, which was strategically timed to capture Houston’s worst air quality days.
McMillan helped provide satellite data during the field study. McMillan said, “We provided AIRS data in as close to near-real time as possible to assist in flight planning for fleets of aircraft making in situ air measurements of air quality around Houston.” AIRS data revealed where high levels of carbon monoxide and other pollutants occurred in the atmosphere over southeastern Texas, determining exactly where the aircraft should fly each day. McMillan retrieved the AIRS data from NASA's Goddard Earth Sciences Data and Information Services Center (GES DISC) and NOAA's National Environmental Satellite, Data, and Information Service (NESDIS). “The people at GES DISC were very helpful, and the data center was instrumental in providing the data,” he said.

Discovering the pollution plume
Even as McMillan and his team provided daily satellite data to guide aircraft flights within the state, remote sensing also permitted the investigators to view larger drift patterns. Estes said, “A satellite can observe large-scale movements of air much better than one or two airplanes or a bunch of ground stations can. Satellite data can often reveal a causal link if you can track the pollutant plume from its origin all the way to the city of interest, kind of a source receptor relationship.” During the field study, air quality experts discovered where some of Houston’s pollution was coming from.
Scientists had already used satellite data to track air pollution from China wafting to North America, and had followed smoke from Brazilian forest fires streaming across the tropics. But AIRS data revealed that the pollution drifting into Houston came from less exotic sources. McMillan said, “One of the biggest impacts that we saw was actually smoke from extensive forest fires in Montana and Idaho. During late August, air pollution from the fires was transported right down across the Great Plains into Texas.” The wildfire smoke, generated between August 26 and 30, drifted 2,090 kilometers (1,300 miles) before blowing into Houston in early September. At the same time, air pollution from the Midwest also drifted into southeastern Texas. Consequently, on September 1, ozone levels in Houston reached 129 ppb. “It was one of the worst ozone events in Houston during the summer of 2006,” McMillan said. “Houston’s poor air wasn’t caused by the drifting pollution, but it was influenced by it.”
Observing how and when pollution was transported into the state helped air quality experts understand the role drifting pollution played in compounding Houston’s already poor air quality. During certain summer days, when Houston’s ambient ozone levels were already high, enough pollution drifted in to produce unacceptable ozone levels. The study helped define an additional challenge for the state: because cities in Texas have no control over pollution generated elsewhere, they must make up for that by more strictly regulating what they can control—their own emissions.
Mitigating the drift
Estes and other air quality officials rely on data from studies like TexAQS II to formulate state air quality programs. They enter the findings into computer-modeled emission scenarios, extrapolate current emissions into the future, and estimate where the state could reduce emissions. For instance, what if industrial plants emitted fewer pollutants, or what if vehicles passed tighter emissions standards? Estes said, “You can run different scenarios and discover the consequences of various emission reductions.” The state then negotiates with local governments and industries to decrease emissions. The resulting package of reductions, explaining how the state will mitigate air quality problems, goes to the EPA.
The field portion of the TexAQS II study confirmed that pollutants from one source might affect a community thousands of miles away. The study also proved that effectively tracking long-distance pollution drift requires broader coverage, so cities like Houston are beginning to incorporate remote sensing into their air quality management. Estes said, “To get data over large areas, you often have to rely on satellite data. If you have good satellite data, you can fill in the blanks between your monitoring stations.” It is an ongoing challenge, but every new source of information supplies experts with one more way to refine pollution models and negotiate emission reductions.
References
McMillan, W. W., C. Barnet, L. Strow, M. T. Chahine, M. L. McCourt, J. X. Warner, P. C. Novelli, S. Korontzi, E. S. Maddy, and S. Datta. 2005. Daily global maps of carbon monoxide from NASA’s Atmospheric Infrared Sounder. Geophysical Research Letters 32, L11801, doi:10.1029/2004GL021821.
Texas Commission on Environmental Quality. Final rapid science synthesis report: Findings from the Second Texas Air Quality Study (TexAQS II) . https://www.tceq.texas.gov/assets/public/implementation/air/am/texaqs/rsst_final_report.pdf
For more information
NASA Goddard Earth Sciences Data and Information Services Center (GES DISC)
Atmospheric Infrared Sounder (AIRS)
Texas Air Quality Field Study II (TexAQS II)
Texas Commission on Environmental Quality (TCEQ)
| About the remote sensing data | ||
|---|---|---|
| Satellite | Aqua | |
| Sensor | Atmospheric Infrared Sounder (AIRS) | |
| Data set | Level 1B AIRS Infrared Geolocated Radiances | |
| Resolution | 13.5 kilometer | |
| Parameter | Carbon monoxide | |
| DAAC | NASA Goddard Earth Sciences Data and Information Services Center (GES DISC) | |