Polar research operations depend largely on local weather conditions and the fortitude of both scientists and accompanying research equipment. Safeguarding personnel and equipment in such isolated areas depends upon support from team members located thousands of miles away. Since timing is all-important, the long-distance support team often must find real- or near real-time information to relay to polar teams.
George Weidner, a research scientist with the University of Wisconsin's Department of Atmospheric and Oceanic Sciences, supports field crews each year, when the University's Antarctic Meteorological Research Center sends a team to Antarctica on a Coast Guard ice breaker to inspect, test and repair the Center's weather stations. Helicopters are required to transport the science team from the ship to the weather stations. However, no matter the wind and ocean conditions, ice breaker movement must be minimized for safe helicopter lift-offs and landings.
In December 1998, Weidner had to find a way to locate regions of sea ice dense enough to allow the U.S. Coast Guard ice breaker Polar Star to dock. "In regions of sea ice, the icebreaker can essentially ground itself in ice to allow the helicopter to take off," he said.
"The Polar Sea departed Hobart, Tasmania for McMurdo Station to service the Automatic Weather Stations along the Adelie Coast near Dumont D'Urville and at sites at Terra Nova Bay and on Franklin Island," Weidner said. "Communications with the Polar Sea were problematic, so in deciding which weather stations to attempt to visit, I downloaded NASA's National Snow and Ice Data Center's Distributed Active Archive Center (NSIDC DAAC) Near Real-Time Snow and Ice Extent (NISE) data for that area of the Antarctic.
"Using the near real-time data, I provided daily forecasts and suggestions about which weather station to visit. For example, the lack of ice at one location coupled with bad weather would lead to suggesting the ship move on to a different weather station. We had use of the icebreaker for a limited amount of time and thus had to go for those sites with the best chance of success," Weidner said.
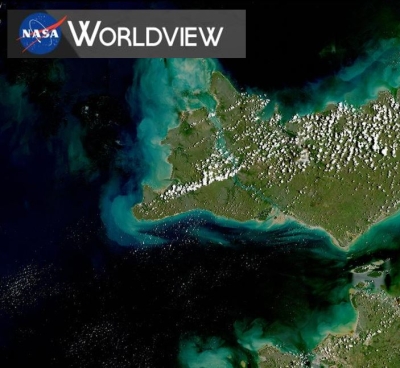
The near real-time data used to navigate the Polar Star was developed at NSIDC DAAC for atmospheric modelers developing algorithms for use with NASA's Terra satellite data. Several instrument development teams require reliable maps of global snow and sea ice extent to increase the accuracy of their models.
"The design of the NISE product was driven by discussions with the instrument teams requiring snow and sea ice data," said Anne Nolin, the NISE principal investigator at NSIDC. "The Marshall Space Flight Center provides us with calibrated passive microwave data within one to two days of satellite observation."

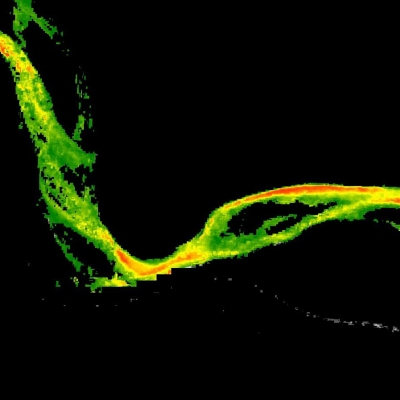
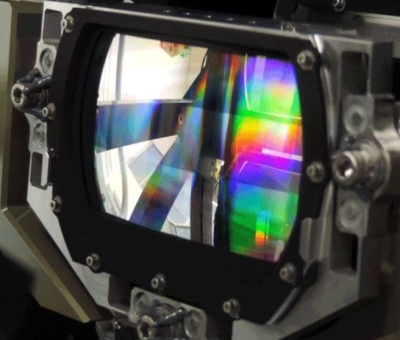
Passive microwave sensors used to collect NISE input data are particularly sensitive to the presence of snow and ice on the ground. Multichannel passive-microwave measurements allow researchers to distinguish between open water and sea ice. Liquid water and ice both emit microwave energy, but in very different amounts. Using this knowledge, researchers can use a simple, linear calculation to relate passive microwave measurements to sea ice concentrations.
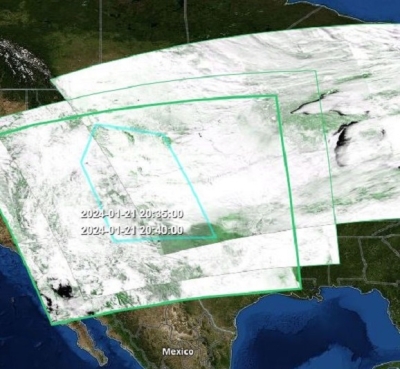
Researchers at NSIDC refine the input data by placing the snow and ice distribution into maps that divide the Earth into a grid comprised of equal-area cells. Using techniques developed at NSIDC and Environment Canada, two essential information sets are offered: a record of snow and sea ice extent, and details describing observation times.
If atmospheric model results and snow and ice cover observations differ, scientists can use data acquisition date information to evaluate inconsistencies. For example, a two- to three-day gap in satellite coverage during spring melt, when rapid changes can occur along the snow line at high and mid-latitudes, can account for major differences in modeled and reported conditions.
While designed to support Terra instruments, NISE data appeal to a surprisingly wide audience.
"Weidner used the information to guide the Polar Star to and through the ice while other scientists used it in Arctic tundra studies," said Nolin. "NISE data are also interesting to researchers who track high-latitude carbon dioxide, New Zealand fishing agencies that ensure compliance with national legislation, and even an artist who is interested in including images of snow and ice as a backdrop in his work."
For more information
NASA National Snow and Ice Data Center Distributed Active Archive Center (NSIDC DAAC)
| About the remote sensing data used | ||
|---|---|---|
| Sensor | Near Real-Time Snow and Ice Extent (NISE) | |
| Parameter | sea ice | |
| DAAC | NASA National Snow and Ice Data Center Distributed Active Archive Center (NSIDC DAAC) | |