During the summer season of 2004, monsoon rains swelled rivers in India, Bangladesh, and Nepal, killing more than 1500 people and displacing millions. Flooding lasted for weeks, inundating thousands of villages and leaving half of Bangladesh under water.
Annual monsoon rains occur every year in Southeast Asia and other parts of the world, but it's difficult to predict how much rain will fall on specific areas, or which rivers will flood. Because periodically flooded soil is so fertile, people use the land during the dry seasons to grow crops and raise livestock. If emergency workers and aid organizations knew in advance which areas might be flooded, they could develop more effective evacuation and flood-response plans for the millions of people who farm floodplains.
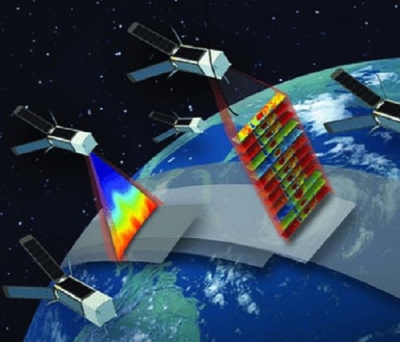
While flood prediction is not yet possible, a growing archive of satellite imagery is allowing scientists to go where aid workers can't. With satellite data, scientists can map floods remotely and piece together long-term trends that will reveal a global picture of flooding.
Fluvial geomorphologist Bob Brakenridge first tested the idea of using satellite imagery to map flooding when the Mississippi River overflowed its banks in 1993. With images from the European Space Agency's ERS-1 satellite in hand, he flew over the river valley and found that the flood extent in the satellite images matched the flooding he saw on the ground. Realizing that it was possible to map floods using satellite data, he established the Dartmouth Flood Observatory (DFO), which tracks floods worldwide and archives related information and data.
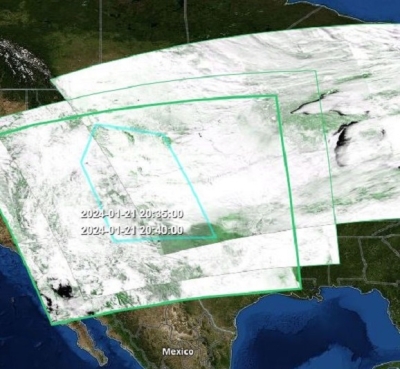
As satellite technology became more sophisticated, Brakenridge began using imagery from NASA's Moderate Resolution Imaging Spectroradiometer (MODIS), obtained from the MODIS Rapid Response web site and NASA's Goddard Earth Sciences Data and Information Services Center (GES DISC). He also uses a QuikSCAT data product developed by Son Nghiem and archived at NASA's Physical Oceanography Distributed Active Archive Center (PO.DAAC).
Although MODIS wasn't specifically designed to observe water levels, Brakenridge said it's the perfect tool. "Before the era of satellite remote sensing, and particularly before MODIS, there was no way to map flooding over large regions," he said.
Because of MODIS' 1-kilometer resolution, the sensor is unable to identify smaller rivers and flood events. But, according to Brakenridge, the wide-area coverage is invaluable for mapping floods. "Some of these flood events affect very large areas. A satellite with high spatial resolution isn't very useful if it means you need 30 scenes to get a complete image of the flood," he said.

To determine what rivers looked like prior to a flood event, Brakenridge's team used MODIS data to develop a baseline map for many of the world's major rivers. Based on the reflective characteristics of each pixel in an image, the researchers can distinguish water from other land cover types. "It's important to have a standard reference so that when we map a flood, we don't mistakenly include areas that are normally under water, such as lakes, reservoirs, or wetlands," he said.
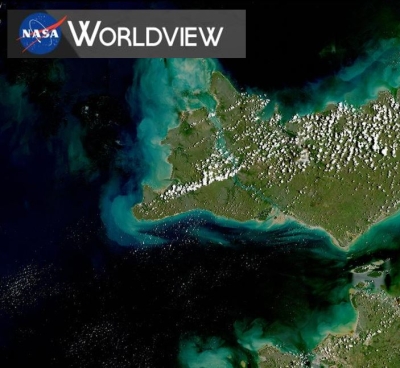
Brakenridge's team at the Dartmouth Flood Observatory posts maps and information on the DFO web site in near-real time. However, when weather agencies and aid organizations need information during or immediately after a flood, they sometimes contact the Observatory directly. In February 2004, parts of New Zealand's North Island experienced severe flooding. Rob Bell of New Zealand's National Institute of Water and Atmospheric Research contacted the DFO to obtain flood maps. The maps showed how much water remained in the affected areas several days after the flood occurred, which was important for emergency managers. The Institute also used the maps to demonstrate the role of remote sensing in assessing such a widespread event and to calibrate and verify proposed computer modeling of the flood, according to Bell.
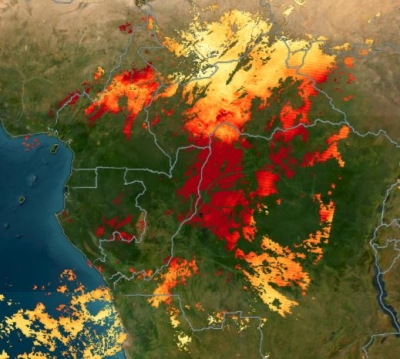
But while New Zealand, the United States, and other industrialized nations have agencies equipped to provide flood warnings, developing countries have no similar protections in place. "Within large parts of Africa, Asia, and South America, there are no flood warning systems. Aid agencies need information about where flooding is occurring," said Brakenridge. By making flood maps available online in near-real time, he hopes to make it easier for aid organizations to use satellite data.
Informing aid organizations about the Observatory's online resources, however, is a difficult process. So, Brakenridge teamed up with the AlertNet web site to help get flood maps to the international aid community. Established by the Reuters Foundation, AlertNet provides news and information to international humanitarian aid and disaster relief organizations.
With support from the European space Agency, remote sensing specialist Oliver Greening of ESYS Consulting produced satellite image content for AlertNet. Having worked in the satellite and Earth observation industry, Greening understands the obstacles associated with using satellite data. "The humanitarian aid community has a strong need for timely satellite imagery," he said. "But many individual organizations don't have the financial resources to purchase the data."
Even though satellite data are freely available from NASA, humanitarian relief agencies don't have the expertise or resources to directly download and process data. AlertNet presents satellite data as imagery that is easy to understand and more meaningful to emergency managers. "It has taken a long time for the international aid community to recognize the value of satellite imagery, but this is beginning to change because of services such as AlertNet," said Greening.

Along with finding new ways to disseminate flood information, Brakenridge is also looking for methods to improve the quality of the maps. He recently started incorporating Shuttle Radar Topography Mission (SRTM) data, obtained from the U.S. Geological Survey, into the flood maps. Because topographic data reveal the elevation of land surfaces beneath flooded areas, Brakenridge can remotely estimate how deep flood waters are by determining which features they cover up.
"SRTM data allows us to do a lot more than we thought we could when we started," said Brakenridge. In addition to improving flood maps, the team can also use the topographic data to map seasonal wetlands, such as those created during monsoons or periodic flooding.
From space, Brakenridge explained, Asia during a normal monsoon season looks dramatically different than it does during the dry season. But as more people crowd into flood-prone areas, or as watersheds change, the normal flood cycle of a river can be seen as dangerous or unusual. "We don't want to make a big fuss about major flooding along a particular river when, in fact, it floods every year," he said. Developing an archive of flood data will help scientists differentiate between normal monsoon flooding and an exceptional flood event.
Normal flooding cycles often produce seasonal wetlands, which contain distinctive types of soil and vegetation that affect larger biochemical cycles. Wetlands are the largest natural source of methane emissions worldwide, according to the U.S. Environmental Protection Agency. Scientists need to know how much methane seasonal wetlands contribute to the atmosphere in order to model methane emissions and understand the role of naturally occurring greenhouse gases.
Wetlands also store large quantities of carbon, giving them a significant role in the Earth's carbon cycle. Scientists modeling the carbon cycle and methane emissions lack accurate global maps of wetlands, said Brakenridge, adding that SRTM and MODIS data will generate the detailed maps that modelers need.
Brakenridge and his colleagues continually update flood information and work to make it easily accessible from the DFO web site. "It's been a mammoth job to compile the information and verify its accuracy. There's a lot of valuable anecdotal information that we don't want to lose, but it's hard to categorize and quantify it," said Brakenridge.
But flood by flood, map by map, the team is developing a long-term archive of satellite data that will help hydrologists monitor floods, allow aid agencies to pinpoint flood-prone regions, and provide information for modeling some of the Earth's complex hydrologic cycles.
References
The Dartmouth Flood Observatory. Accessed March 14, 2004.
Reuters AlertNet Satellite Images. Accessed April 3, 2004.
New Zealand's National Institute of Water and Atmospheric Research. Accessed April 9, 2004.
For more information
NASA Goddard Earth Sciences Data and Information Services Center (GES DISC)
NASA Physical Oceanography Distributed Active Archive Center (PO.DAAC)
| About the remote sensing data used | ||
|---|---|---|
| Satellites | European Remote Sensing satellite 1 (ERS-I) Moderate Resolution Imaging Spectroradiometer (MODIS) Quick Scatterometer (QuikSCAT) Shuttle Radar Topography Mission (SRTM) |
|
| Parameter | flood maps and long-term trends | |
| DAACs |
NASA Goddard Earth Sciences Data and Information Services Center (GES DISC) |
|