Dr. Kristy Tiampo, Director, Earth Science & Observation Center, Cooperative Institute for Research in Environmental Sciences (CIRES) and Professor, Geological Sciences, University of Colorado, Boulder, CO
Research interests: Using high-resolution satellite data and imagery to study natural (and human-created) hazards in order to help mitigate and respond to events caused by these hazards.
Research highlights: Ancient Romans considered Lake Avernus to be the entrance to the underworld and the home of Vulcan, the Roman god of fire. And no wonder. This volcanic crater lake just west of present-day Naples, Italy, is located near the Phlegraean Fields (Campi Flegrei, or “Fiery Fields,” in Italian), which is one of the world’s largest volcanically active regions. Steaming vents and boiling pools of mud surround this supervolcano—as do nearly three million residents of Naples, almost one million of whom live within the Campi Flegrei caldera. As Dr. Kristy Tiampo observes, this high urban concentration makes the caldera one of the most hazardous volcanic areas in the world.

Natural hazards represent a significant risk to the people and economy of every country, notes Tiampo, and are most often a future liability that is difficult to quantify or predict. Using a combination of remotely-sensed satellite data available through NASA’s Earth Observing System Data and Information System (EOSDIS) and ground-based observations, her research seeks to provide a better understanding of the natural (and human-created) hazards affecting urban areas and how these areas might be impacted during a disaster. While hazards such as volcanic eruptions, earthquakes, tsunamis, and landslides haven’t changed, the number of people living in areas susceptible to these hazards has.
According to the United Nations Department of Economic and Social Affairs, more than half (55 percent) of the world’s population now lives in urban areas; this proportion is expected to increase to 68 percent by 2050. In fact, more than 30 cities currently have populations of 10 million or more and are considered “megacities,” according to the World Economic Forum. By 2030, the World Economic Forum expects six new cities to be added to this list: Chicago, Illinois; Bogota, Columbia; Luanda, Angola; Chennai, India; Baghdad, Iraq; and Dar es Salaam, Tanzania. With the exception of Chicago, a critical point to note is that the remaining five cities are all in developing countries and may have significant difficulties dealing with natural hazards and the potential infrastructure impacts caused by these hazards. This is especially true for megacities and other urban areas located on or near coasts. This extreme growth is often coupled with unplanned urbanization and sprawl that has critical effects on coastlines, demographics, and ecosystems.
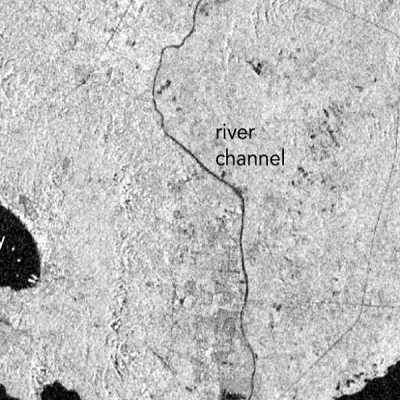
Tiampo relies on high-resolution satellite data and imagery in her studies. A key technology she uses is synthetic aperture radar (SAR). SAR is an “active” radar system, and collects data by sending out a radar pulse that bounces off a surface to detect physical properties (“passive” radar systems, such as a radiometer, sense radiated energy and do not send out a radar pulse). Since SAR relies on reflected microwaves to create imagery, it does not need illumination from an outside source (such as the Sun) to create an image. In addition, the wavelengths used for creating SAR imagery can penetrate clouds, smoke, soil, ice, and tree canopies. This allows high-relief SAR imagery to be created day or night, rain or shine across all biomes.
EOSDIS maintains a large collection of SAR data and imagery, which is available through NASA’s Alaska Satellite Facility Distributed Active Archive Center (ASF DAAC). Along with data from NASA SAR missions, ASF DAAC distributes data from numerous international SAR missions, including the European Space Agency (ESA) Sentinel-1A/B missions and the Japan Aerospace Exploration Agency Advanced Land Observing Satellite (ALOS) Phased Array type L-band SAR (PALSAR) mission.

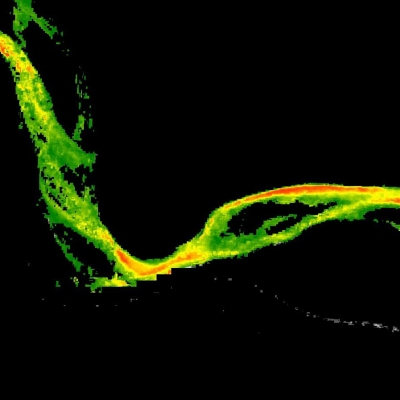
By comparing two SAR images acquired at different dates from the same vantage point in space, changes in topography and elevation can be observed and mapped. These changes can be depicted as multi-colored “fringes,” with the distance between fringes of the same color indicating the precise amount of elevation change. Thanks to the high relief of SAR imagery, these elevation changes can be mapped to a few centimeters or less. This technique is called differential interferometric synthetic aperture radar (DInSAR or InSAR), and images created using this technique are called "interferograms."
Tiampo and her colleagues applied advanced InSAR time series analysis at Campi Flegrei to study vertical and horizontal components of ground deformation at very fine spatial and temporal resolutions over a 20-year time period. The research team found that while the area underwent continuous slow subsidence from 1993 through 1999, moderate uplift began in 2010 and substantially increased through 2012, reaching approximately 13 cm by 2013. This suggests that new magma injected at shallow depths presents increased risk to the local and regional population. While this research was not intended to examine the probability of an eruption, it does indicate that the area warrants watching.
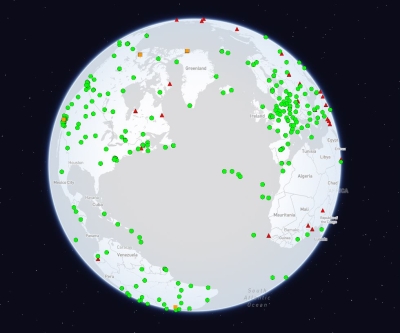
Along with InSAR imagery, Tiampo also uses Global Navigation Satellite System (GNSS) data to characterize long-term surface motions. GNSS data in NASA’s EOSDIS collection are available through the Crustal Dynamics Data Information System (CDDIS), which is the EOSDIS DAAC responsible for geodetic data. A GNSS system has three components: satellites in well-known orbits with synchronized clocks, ground controllers, and a ground segment providing data to users. Using signals from four satellites, a precise location in three-dimensions (within millimeters or less) along with precise time can be determined. By comparing measurements over time, minute elevation and distance changes at a station can be calculated. Tiampo integrates these GNSS data with extremely precise terrain data from the international Shuttle Radar Topography Mission (SRTM) for georeferencing and height corrections.
 and locations of regional seismometers (triangles). Map colors show ground shaking intensity, and range from organge near the epicenter to blue far from the epicenter.")
In a study published in 2017 investigating earthquake intensity, Tiampo and her colleagues made use of a more common data source—Twitter feeds. Since earthquake intensity is one of the key components in the decision-making process for disaster response and emergency services, the research team used advanced Big Data analytics to process Twitter social media feeds along with data from physical sensors (seismographs) to jointly estimate the ground shaking in near real-time from a magnitude 6.0 earthquake that occurred August 24, 2014, in South Napa, CA. The team showed that in the minutes after the event, the joint analysis of social media and data from physical sensors provided better estimates of the location and magnitude of ground shaking than using data from either source alone.
Along with naturally-occurring earthquakes, research by Tiampo shows that human-induced earthquakes also are possible, especially in areas with heavy oil and gas exploration. Anthropogenic earthquakes caused by wastewater injection and the process of fracking have become more common in central North America. In fracking, high-pressure liquid is injected into subterranean rocks, boreholes, and similar features to force open existing fissures to extract oil or gas. One consequence of wastewater injection and fracking is the triggering of seismic activity in areas that have not historically experienced earthquakes and that are relatively unprepared for the associated ground shaking. Tiampo and her colleagues identified the first earthquakes in North America that were induced through the process of fracking. The research team followed these results by using InSAR for detailed studies of ground deformation associated with a series of human-induced earthquakes in Oklahoma, noting “the potential for InSAR to facilitate rapid response efforts for shallow, moderate-sized earthquakes, especially in poorly seismically-instrumented areas.”
Meanwhile, rumbles continue under the Campi Flegrei, where the last known eruption occurred in 1538 and Naples had a population of about 200,000. Today, Naples is one of the most populated metropolitan areas in Italy, with classic Italian red-roofed buildings nestled along the verdant cliffs of the caldera. Far below, magma courses through ancient vents. With the aid of Earth observing data, Dr. Kristy Tiampo is helping a growing global population monitor and be better prepared for the potential hazards of living in urban environments—including the three million neighbors of Vulcan’s home.
Representative data products used:
- SAR data and imagery distributed by NASA’s ASF DAAC:
- ESA Sentinel-1A/B; NASA’s provision of the complete ESA Sentinel-1 SAR data archive through the ASF DAAC is by agreement between the U.S. State Department and the European Commission
- Japan Aerospace Exploration Agency (JAXA) ALOS PALSAR; all PALSAR data and imagery © JAXA/METI
- ESA European Remote Sensing satellites (ERS-1 and ERS-2); NASA’s provision the ERS-1 and ERS-2 SAR data archive via the ASF DAAC is by agreement between NASA and ESA
- NASA Uninhabited Aerial Vehicle Synthetic Aperture Radar (UAVSAR)
- GNSS data; available through NASA’s CDDIS
- SRTM terrain data; available through NASA’s Land Processes DAAC (LP DAAC)
- NASA/JAXA Tropical Rainfall Measuring Mission (TRMM) and Global Precipitation Measurement (GPM) Core Observatory precipitation data related to landslide triggering and flooding; available through NASA’s Goddard Earth Sciences Data and Information Services Center (GES DISC)
Read about the research:
Barba-Sevilla, M., Baird, B.W., Liel, A.B. & Tiampo, K.F. (2018). Hazard Implications of the 2016 Mw 5.0 Cushing, OK Earthquake from a Joint Analysis of Damage and InSAR Data. Remote Sensing, 10(11), 1715. doi:10.3390/rs10111715
Kropivnitskaya, Y., Tiampo, K.F., Qin, J.H. & Bauer, M.A. (2017). Real-Time Earthquake Intensity Estimation Using Streaming Data Analysis of Social and Physical Sensors. Pure and Applied Geophysics, 174(6): 2331-2349. doi:10.1007/s00024-016-1417-6
Tiampo, K.F., Gonzalez, P.J., Samsonov, S., Fernandez, J. & Camacho, A. (2017). Principal component analysis of MSBAS DInSAR time series from Campi Flegrei, Italy. Journal of Volcanology and Geothermal Research, 344(15): 139-153. doi:10.1016/j.jvolgeores.2017.03.004