Dr. Monica Papeş, Assistant Professor, Department of Ecology and Evolutionary Biology, University of Tennessee, Knoxville
Research interests: Using remotely-sensed satellite data combined with ecological niche modeling techniques and GIS to study the geographic distributions of plant and animal species.
Research highlights: Pull up the range map of a plant or animal species and you’ll see a shaded area indicating the general geographic region in which members of that species have been observed. This shaded area tells you where you can expect to find a particular species. A range map, however, won’t tell you why a species lives where it does. Earth observing data in NASA’s Earth Observing System Data and Information System (EOSDIS) collection help Dr. Monica Papeş answer this critical why question.
As Papeş observes, the geographic distribution of a specific plant or animal is deceptively simple (the shaded area on a range map), but is inadequately known in enough detail for most species to address real-world problems such as biodiversity conservation and impacts caused by invasive organisms and disease outbreaks. Despite the great advancements over the past two decades in forecasting biodiversity patterns, she notes that two shortcomings in this area include problems integrating remotely-sensed data into these studies along with the lack of a better understanding of the interrelationships between an organism’s environment and how the organism lives in its environment, which is referred to as ecophysiology.
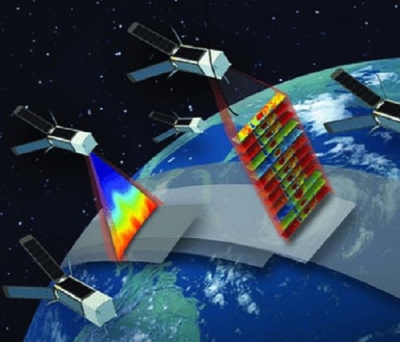
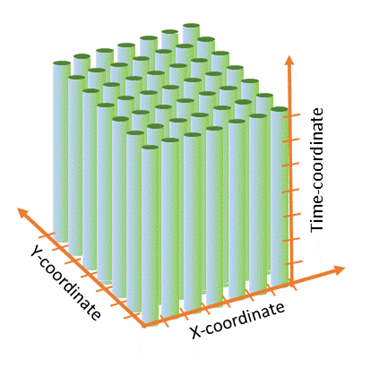
Papeş attempts to achieve three primary goals through her research: develop a better understanding of how species are distributed across broad spatial scales, derive local-scale ecological models that take into account seasonality and the effects of this seasonality on animal distributions, and integrate ecophysiological information into studies of geographic distribution. Remotely-sensed data have a number of attributes that make them a valuable tool in her investigations, including the ability to collect data continuously over spatial scales ranging from regional to continental and to examine the impacts environmental change over time.
Data related to vegetation structure characteristics are an important component of her work, especially data from the Moderate Resolution Imaging Spectroradiometer (MODIS) instrument aboard NASA’s Terra and Aqua Earth observing satellites. Specific MODIS data products used by Papeş include land cover type (which uses colors to differentiate among 18 global land cover types at yearly intervals), vegetation continuous fields (which provides estimates of vegetation type distribution), and vegetation index products (which characterize the global range of vegetation states and processes). MODIS land cover products are available through NASA’s Land Processes Distributed Active Archive Center (LP DAAC). LP DAAC is a partnership between NASA and the USGS, and provides tools and services for discovering and analyzing EOSDIS data related to land cover and land use.

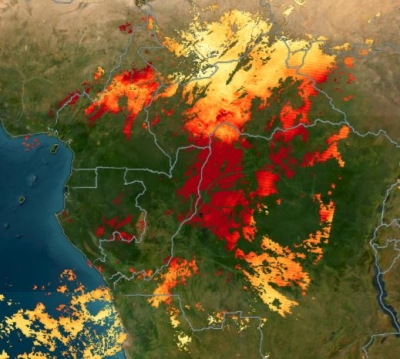
Along with MODIS products, Papeş also utilizes hyperspectral imagery. While humans detect reflected light in the visible region of the electromagnetic spectrum (wavelengths of 0.45 µm [blue] to 0.67 µm [red]), hyperspectral instruments detect a much broader range of wavelengths. Since tree species have unique reflectance values, hyperspectral imagery can be used to identify cover type (e.g., broadleaf vs. conifer), vegetative health, and even individual species. The spectral response of vegetation also varies by season, such as early spring new growth vs. late-summer vegetation and changes in leaf pigments in autumn.
Papeş and her colleagues used hyperspectral imagery from the Hyperion imaging spectrometer instrument aboard NASA’s Earth Observing-1 satellite (EO-1, operational 2000 to 2017) to identify tree species in a lowland forest in the Peruvian Amazon. The research team was able to differentiate the crowns of 42 individual trees in five distinct species and track their spectral changes over time, noting that this research method could be applied in larger studies of spectral-based multi-seasonal species mapping and ecosystem studies.
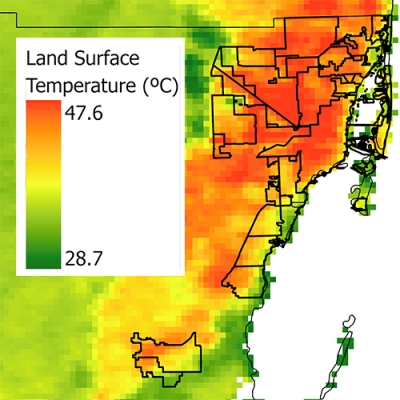
Model data derived from remotely-sensed data also are a component of Papeş’ research. One example is the North American Land Data Assimilation System (NLDAS), which is a collection of quality-controlled, spatially and temporally consistent land surface model datasets. These data are available through NASA’s Goddard Earth Sciences Data and Information Services Center (GES DISC), which is the EOSDIS DAAC responsible for global climate data related to the water and energy cycles, climate variability, atmospheric composition, and solar irradiance along with several land surface hydrology modelling datasets (like NLDAS). Papeş and her colleagues used NLDAS soil temperature data as one component in a study looking at the effects of life-history requirements on the distribution of the alligator snapping turtle.
Before weighing 200 pounds or more and growing to half as large as a six-foot man, alligator snapping turtles begin life as two-to-three-inch hatchlings. Whether a hatchling is male or female, though, depends on the incubation temperature of the nest in which the eggs are laid—embryos developing in warmer nests tend to develop into females; embryos developing in cooler nests tend to develop into males.
Using ecological models designed to examine turtle survival and reproduction, the research team determined that while low annual precipitation constrained the western distribution of alligator snapping turtles, soil temperature during embryonic development constrained the northern range of the species. The team also found that only a portion of the geographic range predicted to be suitable for alligator snapping turtle survival was estimated to be capable of supporting successful embryonic development. Papeş and her colleagues note that their research results “highlight the importance of considering [both] survival and reproduction when estimating species’ ecological niches . . . and the benefits of incorporating physiological data when evaluating species’ distributions.”
From alligator snapping turtles to trees in Peru, each animal and plant species has a reason for living where they do. For Dr. Monica Papeş, remotely-sensed data from the EOSDIS collection greatly facilitate her explorations into the why behind these geographic distributions.
Representative data products used:
- Available through NASA’s LP DAAC:
- MODIS/Terra Vegetation Indices 16-Day L3 Global 250m SIN Grid V006 (MOD13Q1; doi:10.5067/MODIS/MOD13Q1.006)
- MODIS/Terra Vegetation Continuous Fields Yearly L3 Global 250m SIN Grid V006 (MOD44B; doi:10.5067/MODIS/MOD44B.006)
- MODIS/Terra+Aqua Land Cover Type Yearly L3 Global 500m SIN Grid V006 (MCD12Q1; doi:10.5067/MODIS/MCD12Q1.006)
- NASA Shuttle Radar Topography Mission (SRTM) Global 1 arc second elevation maps (doi:10.5067/MEaSUREs/SRTM/SRTMGL1.003)
- Available through NASA’s GES DISC:
- NLDAS soil temperature data
- Available through the USGS EarthExplorer:
- Hyperion hyperspectral imagery from NASA’s EO-1 satellite
- Landsat Enhanced Thematic Mapper+ (ETM+) data
Read about the research:
Thompson, D., Ligon, D.B., Patton, J.C. & Papeş, M. (2017). Effects of life-history requirements on the distribution of a threatened reptile. Conservation Biology, 31(2):427-436. doi:10.1111/cobi.12800
Escobar, L.E., Peterson, A.T., Papeş, M., Favi, M., Yung, V., Restif, O., Qiao, H. & Medina-Vogel, G. (2015). Ecological approaches in veterinary epidemiology: mapping the risk of bat-borne rabies using vegetation indices and night-time light satellite imagery. Veterinary Research, 46(1). doi:10.1186/s13567-015-0235-7
Papeş, M., Tupayachi, R., Martínez, P., Peterson, A.T., Asner, G.P. & Powell, G.V.N. (2013). Seasonal variation in spectral signatures of five genera of rainforest trees. IEEE Journal of Selected Topics in Applied Earth Observations and Remote Sensing (JSTARS), 6(2):339-350. doi:10.1109/jstars.2012.2228468