Dr. Paul Stackhouse, Senior Research Scientist, NASA’s Langley Research Center, Science Directorate/Climate Sciences Branch, Hampton, VA
Research interests: Using satellite observations of the Earth-atmosphere system from multiple sources to study Earth’s global energy cycle, especially the processes that cause variability from global to regional scales. Stackhouse also develops new data products and data systems to help analyze these processes and more efficiently understand and use renewable energy sources.
Research highlights: The U.S. state of Arizona receives a lot of sunshine. According to data available through the National Oceanic and Atmospheric Administration’s National Centers for Environmental Information, Phoenix receives an average of 85% of possible sunshine each year when compared with other U.S. cities (such as Detroit, Michigan, which receives an average of 54% of possible annual sunshine). As a result, Arizona is an ideal location for using solar power.
Solar power is one example of a renewable energy resource. Other examples include wind power, geothermal power, and hydroelectric power. A recent study—Renewable Electricity Futures Study—by the Department of Energy’s National Renewable Energy Laboratory found that “renewable electricity generation from technologies that are commercially available today, in combination with a more flexible electric system, is more than adequate to supply 80% of total U.S. electricity generation in 2050 while meeting electricity demand on an hourly basis in every region of the United States.”
NASA provides ongoing support to the solar energy, energy-efficient building, and agriculture industries through its development of environmental datasets created from data collected by instruments aboard Earth observing satellites. Additional datasets are created from data derived from environmental models that simulate natural processes under future environmental conditions. Dr. Paul Stackhouse leads several NASA initiatives to create and enhance these data products and develop systems to provide these data to a global user community.

A principal effort led by Stackhouse is the Prediction of Worldwide renewable Energy Resources (POWER) applied science project. The purpose of POWER is to improve existing renewable energy datasets and create datasets using data from new and existing satellite missions. POWER is a geographic information system (GIS)-enabled interactive web portal that provides data products customized to three primary user communities: Renewable Energy, Sustainable Buildings, and Agroclimatology. These products are available from daily up to multiple-year averages.
To the Renewable Energy community, POWER provides access to parameters specifically tailored to assist in the design of solar and wind-powered renewable energy systems. For the Sustainable Buildings community, POWER provides access to industry-friendly parameters important for building-system optimization. Finally, POWER provides the Agroclimatology community web-based access to parameters formatted for input to crop models contained within agricultural decision support systems.
POWER utilizes data products from two other projects led by Stackhouse: the World Climate Research Programme (WCRP) Global Energy and Water Exchange (GEWEX) Surface Radiation Budget (SRB) project and the Clouds and the Earth’s Radiant Energy System (CERES) Fast Longwave and Shortwave Radiative Fluxes (FLASHFlux) project. “Radiation budget” refers to the difference between the absorbed solar radiation hitting Earth and the net infrared energy radiated from the surface, regulated by the atmosphere, and ultimately radiated back into space. These energy interactions control Earth’s temperature and rainfall, and take into account the sum of all radiation, transferred in all directions, through Earth’s atmosphere and to-and-from space.
The GEWEX SRB project seeks to determine the radiation budget and its components, including solar energy fluxes, at Earth’s surface and exiting into space spanning from the early 1980’s through near-present time. This information helps us better understand how this energy affects Earth’s overall energy and water cycles over long time scales. Data for the GEWEX SRB project come from the International Satellite Cloud Climatology Project (ISCCP) along with a number of ancillary sources, including data products from models produced by NASA’s Global Modeling and Assimilation Office (GMAO) at NASA’s Goddard Space Flight Center in Greenbelt, Maryland.
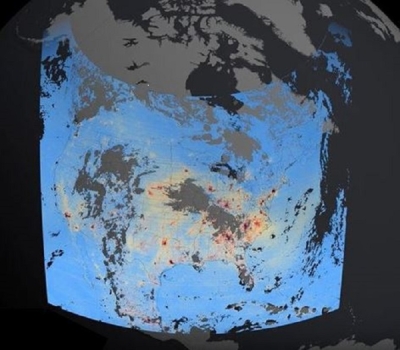
FLASHFlux, which was initiated by NASA’s Langley Research Center in Hampton, Virginia, meets the needs of the science community for global near real-time surface and Top-Of-Atmosphere (TOA) radiative flux data. By speeding up the processing of TOA observations by the CERES and Moderate Resolution Imaging Spectroradiomter (MODIS) instruments aboard NASA’s Terra and Aqua satellites, these data are available about a week after they are collected and provide a first look for global solar and thermal infrared fluxes.
GEWEX SRB and FLASHFlux data are available through NASA's Atmospheric Science Data Center (ASDC) located at NASA’s Langley Research Center. ASDC is NASA's Earth Observing System Data and Information System (EOSDIS) Distributed Active Archive Center (DAAC) that archives and distributes EOSDIS data related to the radiation budget, clouds, aerosols, and tropospheric composition. Data in the GWEX SRB and FLASHFlux collection provide a wide range of information. For instance, SRB and FLASHFlux surface solar energy data products are prepared in customized time series, together with other surface meteorological parameters, to support the solar power industry and for modeling the energy performance of buildings through the POWER web services tool (which also is hosted by ASDC). Current, near real-time data from these projects help systems engineers evaluate the energy performance of solar systems (whether these systems are stand-alone or integrated into buildings), while data related to long-term averages and the variability of solar and surface meteorological information aid in the optimization of building-installed systems for a building’s specific location.

All of these data are available quickly through the POWER web portal. The portal includes multiple data access methods, including an interactive data access viewer, web services, and a full-service POWER Application Program Interface (API). The API capability allows users to access POWER data through their own custom scripts and scalable applications. A great place to start for those new to the POWER portal is the POWER User Guide.
How can these data be used? One example is a recent analysis by Stackhouse and his colleagues on the contribution of solar brightening to the trend in higher U.S. maize yield. As the research team notes, many analyses attribute the increasing maize yield in the U.S. Corn Belt to advances in technology. However, environmental data point to decadal-scale global increases in the amount of incoming solar radiation (“solar brightening”) since the 1980s. The research by Stackhouse and his colleagues shows that “accumulated solar brightening during the post-flowering phase of development of maize increased during the past three decades, causing the yield increase that previously had been attributed to agricultural technology.” One implication of this research is that historical trend data might not be an accurate representation of future crop yields as the global climate continues to change. POWER provides a unified source for these radiation data.
Stackhouse and his teams are working on a number of project improvements. The SRB team is reprocessing the entirety of the GEWEX SRB dataset to produce a 30-plus year record of surface and TOA solar and thermal infrared radiative fluxes that show improved agreement with surface measurements. The CERES FLASHFlux team is preparing to update its algorithm to an improved version with newer CERES instrument calibration and with data parameters and formats more consistent with the CERES Edition 4 climate data products. Finally, the POWER team is working to enhance its current web portal capabilities by providing variability information for parameters related to building energy efficiency.
The efforts of Stackhouse and his colleagues are bringing new radiation data and data products from NASA Earth observing missions and models to support work in a wide range of fields. From the sustainable building industry to agriculture, the projects managed and led by Stackhouse provide a wealth of information for using renewable energy in a changing environment.
Representative data products. All are available through ASDC:
- GEWEX SRB data and data products:
- LW monthly data in 1x1 Degree NetCDF Format (doi:10.5067/SRB/REL3.1_LW_MONTHLY_NC_L2)
- SW Monthly UTC Data in 1x1 Degree NetCDF Format (doi:10.5067/SRB/REL3.0_SW_MONTHLY_UTC_NC_L3)
- CERES FLASHFlux data (doi:10.5067/TERRA+AQUA/CERES/FLASH_TISA_L3.003C)
- Various POWER datasets
Read about the research:
Zhang, T., Stackhouse, Jr., P.W., Cox, S.J., Mikovitz, M.J. & Long, C.N. (2019). Clear-sky Shortwave Downward Flux at the Earth’s Surface: Ground-Based Data vs. Satellite-Based Data. Journal of Quantitative Spectroscopy and Radiative Transfer, 224: 247-260. doi:10.1016/j.jqsrt.2018.11.015
Wong, T., Kratz, D.P., Stackhouse, Jr., P.W., Sawaengphokai, P., Wilber, A.C., Gupta, S.K. & Loeb, N.G. (2018). Earth Radiation Budget at Top-of-Atmosphere [in “State of the Climate in 2017"]. Bulletin of the American Meteorological Society, 99(8): S45-S46. doi:10.1175/2018BAMSStateoftheClimate.1
Yu, L., Jin, X., Kato, S., Loeb, N.G., Stackhouse, Jr., P.W., Weller, R.A., & Wilber, A.C. (2018). Global ocean heat, freshwater, and momentum fluxes [in “State of the Climate in 2017”]. Bulletin of the American Meteorological Society, 99(8): S81-S84. doi:10.1175/2018BAMSStateoftheClimate.1
Tollenaar, M., Fridgen, J., Tyagi, P., Stackhouse, Jr., P.W. & Kumudini, S. (2017). The Contribution of Solar Brightening to the US Maize Yield Trend. Nature Climate Change, 7(4): 275-278. doi:10.1038/nclimate3234
For more information
- National Centers for Environmental Information (NCEI)
- Prediction of Worldwide renewable Energy Resources (POWER)
- Global Energy and Water Exchange (GEWEX)
- GEWEX Surface Radiation Budget (SRB)
- Clouds and the Earth’s Radiant Energy System (CERES)
- Fast Longwave and Shortwave Radiative Fluxes (FLASHFlux)
- International Satellite Cloud Climatology Project (ISCCP)
- Global Modeling and Assimilation Office (GMAO)