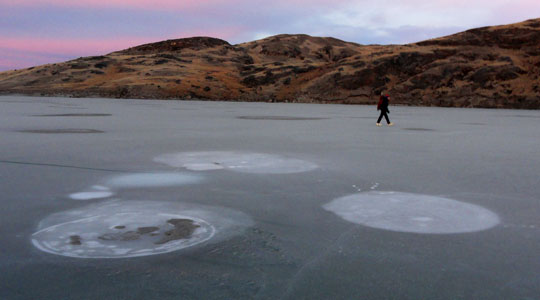
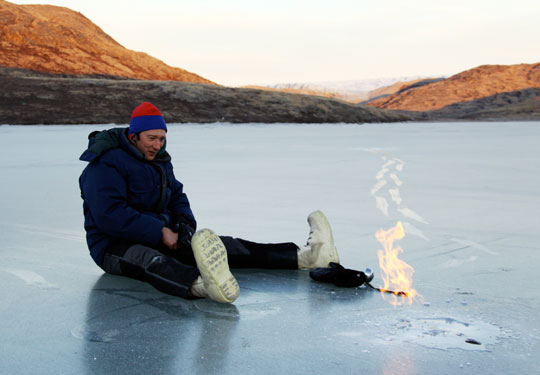
It was nearly winter in Greenland, the tundra patchworked with rumples of earth holding lakes sheathed in smooth ice and snow. Researcher Katey Walter Anthony trudged through the light snow around yet another lake on her survey list, looking for bubbles trapped in the lake ice. “We stumbled across something really weird in a lake right in front of the ice sheet,” she said. “We saw a huge open area in the lake that looked like it was boiling.” Walter Anthony and her team were visiting lakes to measure methane bubbling up. But the roiling seep looked like none other she had seen.
“It looked like something deeper and larger, large plumes of bubbles rushing upward,” Walter Anthony said. “So I got curious: where is this gas coming from and what is the mechanism for its release and how widespread is it?” It was a new twist in the problem of lake ice and methane emissions across the changing Arctic.
Thawing out the freezer
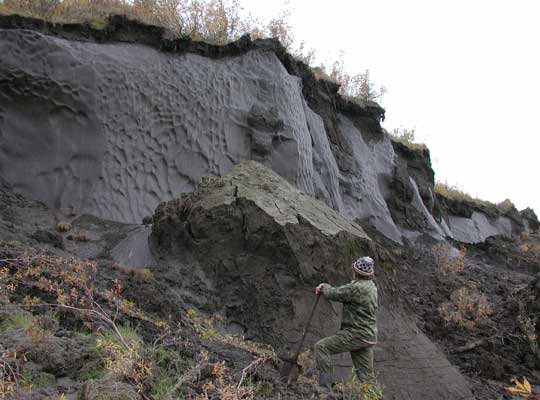
Walter Anthony had been studying methane seeping from Arctic lakes, beginning in northeast Siberia in 2000. Under the lakes, a thick layer of carbon from plants that died hundreds or thousands of years ago stays mostly locked up in permanently frozen ground, like broccoli in the freezer. Today, soils in Siberia and northern Alaska are particularly rich with that organic matter. Now Arctic tundra hovers at a colder temperature that sprouts no trees and only low shrubs and plants, but millions of ponds and lakes. In areas where that permafrost is warming, that organic matter is thawing, rotting, and producing gases that must escape through the lakes.
Guido Grosse studies how these lakes, called thermokarst lakes, form and change. “Permafrost keeps the lakes from draining,” Grosse said. “That’s why there are so many lakes.” In recent years, the Arctic has warmed even more strongly than lower latitudes. Now in many areas, the ground is thawing deeper than it used to. “As permafrost degrades, lakes can drain,” said Grosse, at the Permafrost Laboratory at University of Alaska Fairbanks. In other areas, permafrost thaw results in a sinking land surface where new ponds and lakes form, exposing underlying permafrost to even more warming, thawing, and decay. Grosse said, “The lakes are a big emitter of methane in a warmer climate scenario, a warmer Arctic.”
Some organic material from vegetation and frozen lake banks normally falls in the lake, thaws, and decays around its edges. This decay stops during the cold season in shallow lakes that freeze to the bottom in harsh Arctic winters. But most lakes deeper than 1.5 meters (5 feet) no longer freeze all the way to the bottom. In these lakes, the organic carbon is beginning to thaw and rot year-round, and the permafrost underneath the lake is beginning to thaw out deeply. Microbes decompose organic carbon in the lake sediments, and in the thawed-out zone under the lake, into methane gas that bubbles to the surface. As the lake surface refreezes in fall, researchers can see the bubbles, trapped in the ice. But they lacked wide-scale measurements of the escaping methane.
Bubble, bubble, toil, and trouble
In search of methane bubbles, Walter Anthony’s team traveled to lakes by snow machine, helicopter, hiking in, canoe, and bush airplane. “We’ve gone out now on hundreds of lakes and mapped out these methane seeps, in Alaska, Russia, Canada, Finland, Sweden, and Greenland,” she said. It is painstaking work conducted on often dangerously thin first ice in early winter.
Melanie Engram, who works with Walter Anthony on the methane studies, explained what it takes to measure emissions at a single lake. Engram said, “There often is snow on top of the ice, so first you shovel a 1-meter wide by 50-meter long [3-foot by 164-foot] transect. Then we drill a hole in the ice on one side, and get a bucket of water and pour it over the transect to remove the last specks of snow so we can see through the ice. Then you can easily see, count, categorize, and measure methane bubbles.”
As lakes freeze over in fall, bubbles released from lake sediments get trapped under the freezing surface. The researchers can see stacks of bubbles, separated by thin films of ice, like a time-lapse photograph showing where the bubbles are coming from under the lake.
The bubbles and the rate of gas release vary across a lake, and from lake to lake. “If the bubbles are coming up slowly enough, the ice has a chance to grow around them,” Engram said. “Katey has been working to categorize the bubbles. Type A is slow and indicates a small gas flux hardly keeping up with lake ice growth; with type B, some of the bubbles have grouped together by the time the ice forms. Type C has quite large pillows of gas before the ice forms around it. Each of these categories corresponds to a certain rate of gas seepage.” The “boiling” lakes became a fourth type, called “hotspot,” where methane is nearly continuously seeping out at very high rates. The researchers were able to measure seepage rates for each category by installing automated bubble traps, which look like underwater umbrellas, to measure the gas escaping year round.
As the permafrost thaws
The ultimate goal of the team’s project is Arctic-wide estimates of lake methane emissions. Such estimates are needed for computer climate models, which help test and deepen scientists’ understanding of how Arctic climate responds to change. But with millions of lakes and millions of square miles of Arctic, Engram said, “We can’t go measure every lake. There’s no way of traveling everywhere.”
The team thought they could inspect the lakes and compare field observations with satellite images on a larger scale. Then they could apply the bubble cluster classifications and the measurements from their ground studies to estimate how much methane each lake is emitting. This would give them a way to estimate methane emissions from lakes across the entire Arctic.
Engram said, “Katey had the idea of looking at Synthetic Aperture Radar (SAR) data.” Other researchers had published studies noting that SAR can detect brighter areas corresponding to tubular bubbles in floating ice. Engram said, “We thought, well, if we see brighter ice where there are tubular bubbles, maybe we can find a SAR wavelength that would be sensitive to the various methane bubble types.”
Engram was then working for NASA's Alaska Satellite Facility Distributed Active Archive Center (ASF DAAC), which distributes RADARSAT-1 SAR data. A major challenge was to align the data very precisely with the locations of individual lakes, and she thought she knew how to solve it with a new tool from ASF DAAC. “We took SAR data and pushed it through the Convert tool,” Engram said. The tool converted the SAR data into geolocated files that could be used in ArcGIS, a data mapping software. Engram compared the images with their ground observations. The brighter the ice in the SAR imagery, the more bubbles. Early winter SAR images showed the highest correlation with field measurements of methane bubbles.
Engram said, “It’s important to know how much methane comes out of northern lakes, because methane is a very potent greenhouse gas that is 25 to 28 times more powerful than carbon dioxide at retaining heat in the atmosphere on a 100-year time scale. If we can do this with SAR remote sensing in a way that’s inexpensive, using NASA’s already available data and tools, we could contribute useful estimates to the Arctic methane budget.”
Uncapping the cryosphere
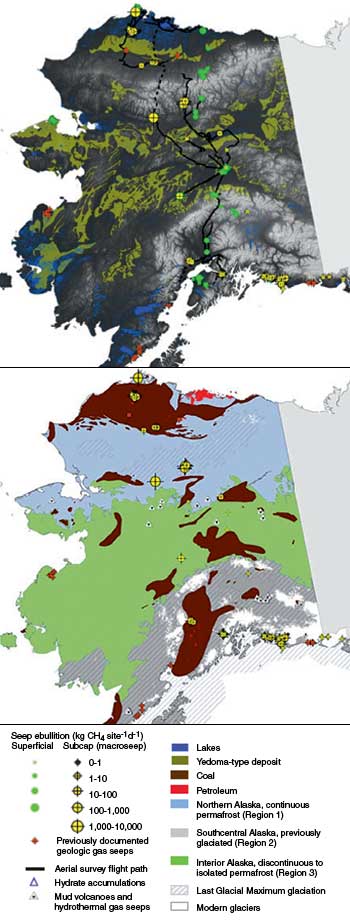
But what about the wildly boiling gas plumes? Walter Anthony still wanted to understand what was happening under the ground to cause such a high flow rate. “My husband and I got in little airplanes and started flying around looking for places in the winter where lakes were open because of methane seepage,” she said. “We flew around and looked at about 6,700 lakes in Alaska, but then we needed to ground truth it. So we went to fifty out of the seventy-seven of the sites where we had seen open areas. We found that yes, every one of them does indeed have very large plumes of methane coming up. But the weird thing is, it was only in certain places.”
Walter Anthony and her colleagues studied the geology of the areas where they located the big seeps. In the Arctic, frozen ground can keep gas trapped for thousands of years. “Permafrost is a thick cap that seals off deeper geologic layers by blocking pathways through pore spaces with ice,” she said. “There is natural gas underneath some permafrost regions, and that gas cannot escape into the atmosphere because the permafrost is impermeable.” The team did a geospatial analysis, and found that the gas plumes were near places where glaciers and ice sheets are retreating, and where the thickest, most extensive layers of permafrost are now disintegrating from warming and thawing.
These methane emissions are strong, but transient. “If you’ve got a pot of water boiling on the stove with a lid on top, you have a bunch of steam that’s building up inside of there, you take the lid off, that steam goes up, poof! But then the air clears,” Walter Anthony said. “And in the same way you pull back this cryosphere cap, it lets the methane out in a poof, over probably a century to thousands of years.” On a human scale, that poof of methane means large amounts of carbon added to an already warming atmosphere. “The lakes are much bigger emitters than we thought before, now that we have come to understand how much methane is actually bubbling out of the lakes,” Walter Anthony said. “In the future we don’t know what will happen. It is a bit of a wild card.”
Sorting out all of these contributions helps scientists factor methane emissions into the overall study of Earth’s climate. “Our work is another piece of the puzzle, closely linked to other processes associated to a changing world, and important if you want to know how much methane and carbon dioxide will be emitted in the future,” Grosse said.
References
Walter Anthony, K. M., P. Anthony, G. Grosse, and J. Chanton. 2012. Geologic methane seeps along boundaries of Arctic permafrost thaw and melting glaciers. Nature Geoscience, doi:10.1038/Ngeo1480.
Grosse, G., J. Harden, M. Turetsky, D. A. McGuire, P. Camill, C. Tarnocai, S. Frolking, E. A. G. Schuur, T. Jorgenson, S. S. Marchenko, et al. 2011. Vulnerability of high-latitude soil organic carbon in North America to disturbance. Journal of Geophysical Research - Biogeosciences, 116: G00K06, doi:10.1029/2010JG001507.
Walter, K. M., M. Engram, C. R. Duguay, M. O. Jeffries, and F. S. Chapin III. 2008. The potential use of synthetic aperture radar for estimating methane ebullition from Arctic lakes. Journal of the American Water Resources Association 44(2): 305–315, doi:10.1111 ⁄j.1752-1688.2007.00163.x.
Walter, K. M., S. A. Zimov, J. P. Chanton, D. Verbyla, and F. S. Chapin III. 2006. Methane bubbling from Siberian thaw lakes as a positive feedback to climate warming. Nature 443, doi:10.1038/nature05040.
For more information
Alaska Satellite Facility Distributed Active Archive Center (ASF DAAC)
Canadian Space Agency RADARSAT-1
| About the remote sensing data used | |
| Satellite | Canadian Space Agency RADARSAT-1 |
| Sensor | Synthetic Aperture Radar (SAR) |
| Data sets | Level 1 |
| Resolution | 25 meters |
| Parameter | Reflectance |
| DAAC | NASA Alaska Satellite Facility Distributed Active Archive Center (ASF DAAC) |
The photograph in the title graphic shows researcher Melanie Engram prodding the snow on the lake surface to check for thin ice, before approaching the snow-free circles that suggest methane seeping from underneath the lake. (Courtesy K. W. Anthony)
