After the fresh snow, the forest is quiet, save for the soft crunch of snowshoes. High in the rugged terrain of Olympic National Park, two hikers find the long metal snout of a scientific instrument barely poking through five feet of snow from an epic storm. It is no small job to shovel out the instrument, riding on sawhorse legs too short to keep its nose above the surface. Its camera can capture high-resolution video of falling snowflakes and raindrops—but not from beneath a snowdrift.
The instrument and its minders are part of a NASA mission to enable satellites to better measure precipitation in all types of terrain. When University of Washington professor Lynn McMurdie and colleagues designed the Olympic Mountains Experiment (OLYMPEX), they got what they wanted, and then some. They knew that the park’s mountainous landscape and stormy weather would be ideal for studying precipitation in the mountains. They had given slight thought to how they would get equipment into the remote mountain sites, and maintain it all winter. What they had not considered was how wind storms, heavy rains and flooding might nearly drown instruments and make trails to them impassible. Park Service scientist Bill Baccus said, “Nearly the entire area was a designated wilderness, with no roads, no electricity and strict regulations concerning installations and helicopter use. While the area had elements ideal for the study, it was not a very practical place to do the work.” The researchers were undeterred. “We need to know how much it rains, where, and when,” McMurdie said.

Ready or not, here it comes
The last of many ground instrument sites for OLYMPEX had just been installed in the park when a November 2015 storm dropped up to 10 inches of precipitation, falling mostly as rain at both lower and high elevations. While nearby communities braced for flooding, McMurdie, the OLYMPEX project manager, was excited. After two years of planning, the heavy rains over the mountains were a precipitation scientist’s dream.
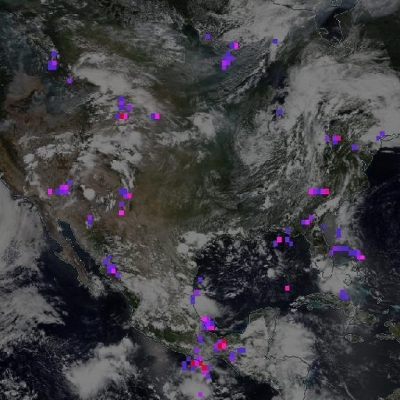
McMurdie and her colleagues would collect data to evaluate how well the recently launched Global Precipitation Measurement (GPM) mission measures precipitation from space. The GPM Core Observatory and other GPM satellites together provide worldwide observations of rain and snow every three hours. The Core satellite was designed to sense a wide range of precipitation—such as drizzle, rain, snow and sleet—including rain and snow influenced by terrain. The meteorological phenomenon, called orographic precipitation, is McMurdie’s bailiwick.

Complicated storms coming from the ocean get even more complicated when the storms encounter mountains. When moist air of a storm runs into mountains, it is forced to rise up and over the mountain slopes. As it rises, the air expands and cools, and when it cools enough to reach saturation, rain or snow can form and fall onto the ground. As the saturated air flows over the top of the mountain crest, it continues to create rain and snowfall, but as it reaches the lee side of the mountains, the air will start to sink and warm on the other side, becoming unsaturated so that rain and snow no longer forms. Because of this rising and sinking of moist air over the slopes, the windward side often gets much more rain and snowfall than the lee side. However, not all storms are the same. Sometimes instead of flowing up and over the mountains, the air can go around the mountains. Or in some storms, the lowest level air goes around the mountains, but the mid level air goes up and over the mountains. These complex air flow patterns make the distribution of rain and snow in mountainous regions quite variable.
“But how, physically, does it happen?” McMurdie said. Forecast models have to make approximations of how precipitation particles form and change. “When it comes to big flooding events, forecast models often under-predict how much rain comes out of the sky and the possibility of flooding,” McMurdie said. More details about orographic precipitation would help researchers better interpret the data coming from GPM, and help them dial in the models that consume the data.
And then there is snow. “It’s incredibly hard to figure out how much water is in the snow while it’s falling,” said OLYMPEX snow scientist and professor Jessica Lundquist. “It’s a lot easier to measure when it’s on the ground. Then we can measure snow depth. But what hydrologists want is snow water content: if you melt down that snow, how much water do you have?” she said. Snowfall in the Olympic Mountain Range is even harder to measure, because it may be a mix of rain and snow.

Measure, measure, measure
Storms roll in from the Pacific Ocean and abruptly meet the Olympic Mountains, rising to dump heavy precipitation on rainforests in the western valleys and ridges on their way east. A network of instruments would follow their progress. On the coast, a dual polarization S-Band Doppler radar called NPOL and a Ka- Ku-Band radar called the D3R would characterize the storms as they approached the mountains. The team needed to check these radars daily, accessing them over often muddy and rutted roads. Because the coastal Doppler could not see all the way to the valley floor, researchers installed another Doppler radar on a flatbed truck and placed it near Lake Quinault in the Quinault Valley. A fourth radar was placed on Vancouver Island to intercept the storms on the lee side of the Olympic Mountains.
In between the windward and leeward sides, where the mountains would catch the precipitation, the team strung instruments at different elevations to measure the rain and snow and observe the shape, size, and velocity of drops and flakes. As the sites became steeper, higher, and wilder, instrument placement became more challenging. Mule trains carried equipment in pieces over rough trails to higher elevations, while in the highest and remotest locations the team got creative. “Extremely hardy students carried twelve-foot snow measuring poles to eighteen remote sites,” Lundquist said. “The Park Service also sent out scientists via helicopter who went and probed snow depth and weighed the snow.” Sophisticated instruments like the Parsivel Disdrometer and the soon-buried Precipitation Imaging Package were deployed in some areas, and in others lower-tech instruments such as the snow measuring poles. McMurdie admitted it was challenging. “It was hard getting instruments into the wilderness and keeping things working when it’s a fifteen-mile hike in,” she said.
OLYMPEX found a great partner in Baccus. It was clear to him that they would need logistical help from his team, who knew the terrain and had the backcountry skills, to site dozens of precipitation instruments in the park and across the Olympic Peninsula and its river basins, and to help researchers access the backcountry safely. “The most interesting part of the program were the several trips in mid-winter to the Enchanted Valley and upper Quinault headwaters,” Baccus said. “We don’t normally go there in the wintertime. It was a unique opportunity to get up into some very remote sites in the winter.”
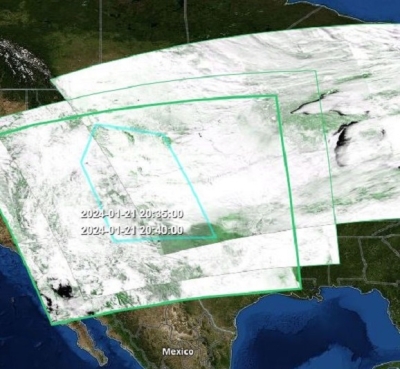
At the same time, aircraft were ready to watch the storms from above. Four NASA research aircraft, including the DC-8 flying laboratory and the ER-2 aircraft, carried precipitation-sensing radars and passive microwave sensors similar to the GPM satellite instruments, so that the team could compare what the satellite would see to actual ground observations and measurements. Another aircraft flew inside the clouds equipped with instruments to measure the sizes and shapes of the snow and rain as they were created in the clouds. The Airborne Snow Observatory aircraft flew two lidar flights to measure the depth of the snowpack over the entire Olympic Mountains late in the winter season.
In early October, the storms began to roll in, over and over, continuing until the next May.

A vertical view
The design of the study, and its many instruments and platforms, began to unveil some of the unknowns in how orographic rain and snow form. Do ice crystals get thrown high aloft, then turn to rain, or does the uplift of warm air create small drops? “We’re finding that it’s both,” McMurdie said, “and small drop production is important.”
Since mountains block the radars’ view, the DC-8 and ER-2 flew over the tops of the storms, with their radars looking down through the storm. Orographic precipitation had never been sampled in this way. “Along a line, we documented exactly how the rain patterns, the production of rain in the atmosphere, the whole vertical depth change as you go across a mountain barrier. I had never seen that before,” McMurdie said. The insights from these data will change assumptions that algorithm developers have been using for their precipitation models. These results are also critical for improving the satellite measurements of rain and snow.
Lundquist said that the data are promising for snow as well. Colleagues ran a weather model and compared its output with OLYMPEX snow observations. She said, “It was able to represent snowfall surprisingly well.” The model could also differentiate rain, graupel, and snow. “It’s still not perfect, as mixed rain and snow events are difficult to get right. But the data from OLYMPEX are helping us improve snow modeling,” she said.
When OLYMPEX ended in 2016, it left mountains of data, which researchers will analyze for years to come. “It’s one of the best data sets ever collected of rain and snow in mountainous regions,” McMurdie said, “because of the design of the network, the fact that Mother Nature cooperated, and we were ready. The very first day we had the biggest storm in the whole campaign, and we were ready.” NASA's Global Hydrometeorology Resource Center (GHRC) Distributed Active Archive Center (DAAC) is in the process of archiving the entire OLYMPEX data collected. Published data are available at https://ghrc.nsstc.nasa.gov/hydro/?q=OLYMPEX.
It took the Park Service over a year to clear and repair the trails into the high country and they still need to retrieve some equipment from the wilderness. “I’m glad the project is over and this winter we didn’t have to go up there over and over again,” Baccus said. As a scientist and park steward, he looks forward to the long-term results. He said, “We are really interested in the science moving forward. We may get better information from satellites about how much rain is falling, or how much water is in our snowpacks. These are the types of tools we’ll need in the future.”

References
Currier, W. R., T. Thorson, and J. D. Lundquist. 2017. Independent evaluation of frozen precipitation from WRF and PRISM in the Olympic Mountains, WA, USA. Journal of Hydrometeorology. doi:10.1175/JHM-D-17-0026.1.
Houze, R. A., Jr., L. McMurdie, W. Peterson, M. Schwaller, W. Baccus, J. Lundquist, C. Mass, B. Nijssen, S. Rutledge, D. Hudak, S. Tanelli, J. Mace, M. Poellot, D. Lettenmaier, J. Zagrodnik, A. Rowe, J. DeHart, L. Maddaus, and H. Barnes. 2016. Olympic Mountains Experiment (OLYMPEX). Bulletin of the American Meteorological Society, accepted. doi:10.1175/BAMS-D-16-0182.1.
Houze, R. A. et al. Olympic Mountains Ground Validation Experiment (OLYMPEX). Dataset available online from the NASA Global Hydrometeorology Resource Center DAAC, Huntsville, AL, U.S.A. https://ghrc.nsstc.nasa.gov/home/field-campaigns/olympex.
For more information
NASA Global Hydrometeorology Resource Center Distributed Active Archive Center (GHRC DAAC)
Olympic Mountain Experiment (OLYMPEX) field campaign
| About the data | |
|---|---|
| Platforms | Global Precipitation Measurement Mission NASA DC-8 aircraft NASA ER-2 aircraft UND Citation II aircraft NASA/JPL Airborne Snow Observatory Ground stations |
| Sensors | See list at https://ghrc.nsstc.nasa.gov/home/field-campaigns/OLYMPEX/instruments |
| Data set | Olympic Mountains Ground Validation Experiment (OLYMPEX) |
| Parameters | Precipitation and other meteorological parameters |
| DAAC | NASA Global Hydrometeorology Resource Center Distributed Active Archive Center (GHRC DAAC) |