Shortly after the boat set out onto Lake Huron, dense fog swelled. Unable to see beyond the bow, radar guided the researchers to Spectacle Reef Light, a lighthouse, 11 miles offshore. “We literally almost hit our heads on it,” said Peter Blanken, a researcher from the University of Colorado Boulder. The team was checking on the instruments on top of the lighthouse, which was being used as a key research site.
The Great Lakes contain 20 percent of the world’s surface fresh water and provide 35 million people with drinking water. “Surprisingly we know very little about them,” Blanken said. “They’re very poorly studied.” Their immense size has led many to perceive them as unresponsive to climate change. From 1998 to 2014, water levels dropped in the Great Lakes to the longest low-level period in over 100 years. Then in 2016, water levels recovered in Lake Huron, jumping more than three feet after 12 days of rain.
Precipitation is one driver of year-to-year fluctuations, but Blanken suspected another cause. After observing evaporation in the Great Slave Lake, an extensive lake in northern Canada, Blanken had a hunch evaporation may also play a major role in the Great Lakes’ water cycle. Understanding how evaporation works and what it contributes to lake-level changes would provide insight on where lake levels are headed in the long term.

The lake dimension
On still days, Lake Huron turns into a sheet of glass, where the horizon and water surface blur into one another. In the eerie dead calm, sound carries through biting cold and a jumping fish startles with a bang. “The lakes are so big you think you’re on the ocean,” Blanken said. Sailing out there is not easy. On stormy days, 40-foot waves have been known to rip vessels in two.
Winters also take their toll. After 2009, when Blanken equipped the top of Spectacle Reef Light, he returned yearly for upkeep. Though just a point on the lake, the lighthouse offered direct measurements that could validate satellite readings to then calculate lake-wide evaporation. Spectacle Reef Light is one of only a few lighthouses built on concrete platforms surrounded by water. These tall, stable structures make prefect weather towers. Without interference from land surfaces, the instruments record clean field measurements, and Spectacle Reef Light is the only station on Lake Huron measuring offshore, year-round weather.
The results challenged the researchers’ preconceived notions. The three key components of evaporation include heat, wind, and atmospheric vapor pressure. The sun drives evaporation, warming the lake surface and breaking molecular bonds that increase humidity in the atmosphere. And just like wet clothes on a clothesline dry faster in the wind, faster winds sweep more water molecules off the lake surface, increasing evaporation. The lower the atmospheric vapor pressure, the greater the lake-air difference in vapor pressure, the more easily water molecules lift off the surface, increasing humidity.
Evaporation rates depend on the difference between the humidity at the lake surface and in the atmosphere. A dry atmosphere drives more evaporation. That seems straightforward, though these lakes defied expectations. “This is one of those oh-my-gosh-how-can-that-be stories,” Blanken said. The most surprising finding was that evaporation was not a summer phenomenon.

Cold sweat
“When you’re standing on the shore in July and you tell someone there is no evaporation from the lakes, they can’t believe it,” Blanken said. In the summer, the lakes are colder than the atmosphere so all the solar energy goes to warming the waters, not evaporation. When winter arrives six months later, these giant lakes are warmer and humid compared to the cold, dry atmosphere, boosting heavy evaporation loss.
The other misconception is that winter ice suppresses evaporation. People assume a year with a lot of ice cover will have little evaporation, but the opposite is true. Evaporation rates in the fall and early winter help determine the extent of winter ice cover. A large amount of heat loss from the lakes is required to cool the water enough to ice over. Cold, dry air pulls more water molecules off the lake surface. During a cold fall and early winter, high evaporation rates help cool the water surface, promoting broad ice cover in the winter.
In a very cold year, evaporation rates surge. “The lake’s evaporating like crazy,” Blanken said. Then ice builds. Complete ice cover would stop evaporation, though that seldom happens. During a warm fall, on the other hand, the temperature and vapor pressure differences between the lake surface and atmosphere are not large enough to promote major evaporation, so the lake does not cool enough to build its winter ice.
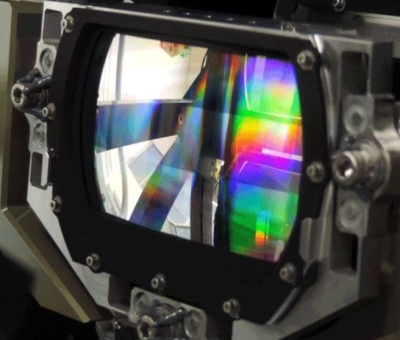
The researchers used the data from the instruments on the lighthouse to calibrate and verify satellite remote sensing for a lake-wide estimate of evaporation. “Quantifying evaporation is the hardest part of this study,” said Pakorn Petchprayoon, a researcher from Geo-Informatics and Space Technology Development Agency in Thailand. On top of the lighthouse, gadgets spin and record the energy exchanges of the water molecules—their rise and fall, speed and direction, and density. With additional parameters like water and air temperature and vapor pressure, the team used an equation to calculate evaporation at the lighthouse. “One in situ point is not enough to represent the lake as a whole,” Petchprayoon said. Remote sensing then was critical.

Up in the air
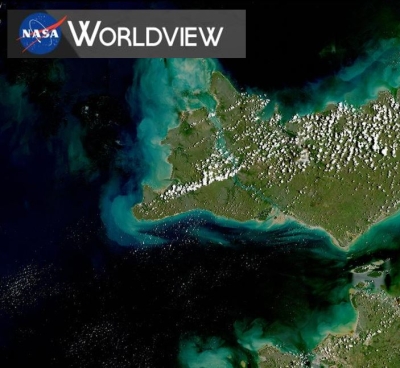
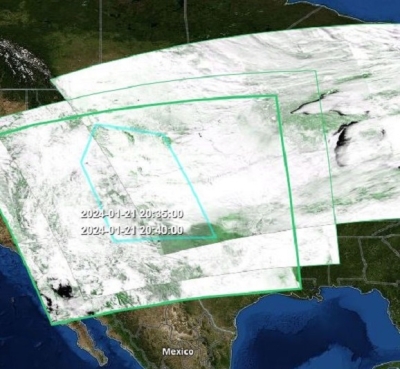
“We believe the laws of physics don’t change from here to there,” Blanken said. “So we used remote sensing to move us around spatially.” To estimate evaporation for the entire lake, the team plugged in satellite data values from the rest of the lake. The key variable was surface temperature from NASA's Moderate Resolution Imaging Spectroradiometer (MODIS) satellite instrument. Comparing satellite data with the field measurements showed the two agreed. After calculating evaporation at the lighthouse, they next calibrated satellite products to extrapolate, pixel by pixel, for a lake-wide estimate.
The water loss is huge. Depending on the year, Lake Huron loses roughly a meter of water level a year. It is not alone. The researchers had previously seen similar losses in Lake Superior.
Remote sensing also allowed the team to go back in time. Measurements from the lighthouse began in 2009, and remote sensing data stretches back to 2002. The study calculated evaporation from 2002 to 2012, and even in that time evaporation increased, driven by higher surface water temperatures. “Climate change is definitely increasing evaporation,” Petchprayoon said. This does not surprise him. What does is the erratic pattern of evaporation in one year. For instance, November dips after an increase in evaporation in October, only to start back up again in December.
Overall, evaporation on the lakes is becoming more dynamic. Using remotely sensed ice-cover data from the US National Ice Center and the Canadian Ice Service, the team saw that prior to 1998 ice cover behaved consistently, but after 1998 it has been highly variable. Years with high ice cover have been followed by years of record-low ice cover. And since what happens in the winter affects the following summer, and summer affects winter, the variability increases evaporation because the system is trying to balance out. That is why scientists are beginning to see abrupt oscillations in lake water levels.

Flashback
Water levels in the Great Lakes will continue to fluctuate, as they have over the past century, corresponding to changes in the water balance. The question now: Have we reached a tipping point or is climate change a more gradual effect?
The lighthouses possess historical data that may give insight into the extent of lake response to climate change. The keepers, who often lived offshore in isolation, kept the lights moving from 1874 until 1970 when lights became automated. They kept daily observations of weather—air temperature, barometric pressure, and wind speed and direction. Blanken visited the National Archives in Washington, DC where the logbooks are stored. “Sometimes the keepers would write ‘blustery winds out of the north,’ ‘lake making steam today,’ ‘ice surrounding the lighthouse today,’ or ‘waves breaking over top,’” Blanken added. “There’s a wealth of data there.” These data have yet to be analyzed.
In the meantime, climate change predictions anticipate further sudden water level changes. As this study shows, these beasts of fresh water are more fragile than suspected. “When I’m out there doing fieldwork, I think, ‘How can such a large volume of water be so dynamic?’” Blanken said. He thought the lakes would be irresponsive to short-term atmospheric conditions, but they are not. “They respond quickly, which still surprises me.”

References
Blanken, P. D., C. Spence, N. Hedstrom, and J. D. Lenters. 2011. Evaporation from Lake Superior: 1. Physical controls and processes. Journal of Great Lake Research 37: 707–716. doi:10.1016/j.jglr.2011.08.009.
Borbas, E., et al., 2015. MOD07_L2 MODIS Atmosphere L2 Atmosphere Profile Product. NASA MODIS Level-1 and Atmosphere Archive and Distribution System (LAADS) Distributed Active Archive Center (DAAC), Goddard Space Flight Center, Greenbelt, MD. doi:10.5067/MODIS/MOD07_L2.006.
MODIS Science Data Support Team. 2012. MOD03 MODIS/Terra Geolocation Fields 5-min L1A Swath 1km. NASA MODIS Level-1 and Atmosphere Archive and Distribution System (LAADS) Distributed Active Archive Center (DAAC), Goddard Space Flight Center, Greenbelt, MD. doi:10.5067/MODIS/MOD03.061.
Petchprayoon, P., P. Blanken, K. Hussein, W. Abdalati, and S. Lawavirotwong. 2016. A decade of changing surface energy balance components over a large water region. Proc. SPIE 9999, Remote Sensing of the Ocean, Sea Ice, Coastal Waters, and Large Water Regions. doi:10.1117/12.2241516.
Platnick, S., M. King, and G. Wind. 2015. MOD06_L2 MODIS/Terra Level-2 (L2) Cloud Product Swath, 1km and 5km Resolution, 5 minute time-period HDF files. NASA MODIS Level-1 and Atmosphere Archive and Distribution System (LAADS) Distributed Active Archive Center (DAAC), Goddard Space Flight Center, Greenbelt, MD. doi:10.5067/MODIS/MOD06_L2.006.
Wan, Z. and S. Hook. 2015. MOD11_L2 MODIS/Terra Land Surface Temperature/Emissivity 5-Min L2 Swath 1km V006. NASA EOSDIS Land Processes DAAC, USGS Earth Resources Observation and Science (EROS) Center, Sioux Falls, SD (https://lpdaac.usgs.gov). doi:10.5067/modis/mod11_l2.006.
For more information
NASA Land Processes Distributed Active Archive Center (LP DAAC)
NASA Level 1 and Atmosphere Archive and Distribution System DAAC (LAADS DAAC)
NASA Moderate Resolution Imaging Spectroradiometer (MODIS)
| About the remote sensing data | |||
|---|---|---|---|
| Satellite | Terra | Terra | Terra |
| Sensor | Moderate Resolution Imaging Spectroradiometer (MODIS) | MODIS | MODIS |
| Data sets | Geolocation Fields 5-Min L1A Swath 1km (MOD03) | Cloud Product (MOD06) | Atmosphere Profiles (MOD07) |
| Resolution | 1 kilometer | 5 kilometer | 5 kilometer |
| Parameters | Geolocation data | Cloud optical properties | Air and dew point temperatures |
| DAAC | NASA Level-1 and Atmosphere Archive and Distribution System Distributed Active Archive Center (LAADS DAAC) | NASA LAADS DAAC | NASA LAADS DAAC |
| About the remote sensing data | |
|---|---|
| Satellite | Terra |
| Sensor | MODIS |
| Data set | Land Surface Temperature and Emissivity (MOD11_L2) |
| Resolution | 1 kilometer |
| Parameter | Land surface temperature |
| DAAC | NASA Land Processes DAAC (LP DAAC) |