The largest recorded iceberg, Iceberg B-15, rivaled Connecticut in size when it calved from Antarctica’s Ross Ice Shelf in March 2000. Giant chunks eventually wandered into the Southern Ocean. Twelve years later it was gone. Ice shelves secure glaciers in place. Both birth icebergs as a natural process, much like shedding dead skin cells, but ice shelf calving does not add to sea level rise because its ice already floats in water. Glacier calving and melting, however, account for half of sea level rise by draining ice from land to ocean. When ice shelves collapse, glaciers speed up, dumping more ice into the ocean.
Warming waters yield the other half of sea level rise. Like mercury in a thermometer, water expands as it warms. Sea levels climbed faster in the twentieth century than in the previous 3,000 years, and are accelerating. Conservative sea level estimates foresee a one- to four-foot rise by the year 2100, with the last twenty-four years of satellite measurements averaging an annual 3.4-millimeter global rise. Monitoring rates of change in millimeters requires precise measurements. “To model that you have a simple approximate for a very complex reality,” said Nikita Zelensky, a chief scientist at Stinger Ghaffarian Technologies (SGT). Measuring a moving, bulging ocean is no easy task. How do scientists get accurate sea level measurements?

Caught in a drift
One task of altimeter satellites is measuring sea surface height, which can get down to the centimeter, but for scientists to use that precise measurement, they need to know the satellite’s location at all times. To know that scientists have to understand Earth’s atmosphere and refraction, and factor in a satellite’s shape and reflective properties. They have to know the laws of physics that allow a satellite to orbit Earth and how a myriad of forces—ocean tides, moon and sun perturbations, and solar photon pressure—impact it over time. More nuanced forces like Earth’s heating and cooling also act on the satellite. “That’s a whole family of unruly relatives we’re trying to better understand,” Zelensky said. But gravity is the kicker.
Earth’s gravity field reflects Earth’s mass distribution, which gets rattled by the global water cycle, movement in the atmosphere, and mass transport in the ocean. “What we’re concerned about is how accurately we model the variations in Earth’s gravity field over time,” said Frank Lemoine, a geodesist with NASA. To measure ocean surfaces, scientists use an idealized Earth that averages gravitational pull. Gravity, like water, shifts. The ocean stirs continuously. It rises and falls with tides and currents, while changes in winds and salinity, or density, fluctuate currents. Temperature change is not uniform around the globe, so parts of the ocean will warm faster than others, causing sea levels to rise disproportionately.
Altimeter satellites easily measure these changes by calculating sea surface height from a stable reference point, Earth’s center of mass. “But one of the challenges of using altimeter data from any satellite is to compute where the satellite is as a function of time,” Lemoine said. Because altimeter satellites measure the radar pulse bounce from satellite to ocean surface in centimeters, knowing their precise location is critical. The challenge has been in determining Earth’s center of mass—a nuanced, fickle point because of continuous mass redistribution on Earth’s surface.
Earth is also not perfectly round. Squished at the poles, Earth bulges at its midsections. Beyond that, its crust is dynamic, jolted by earthquakes, while also slowly rebounding from the last Ice Age when giant ice sheets crept over the Northern Hemisphere, deforming the ground. So scientists use a theoretical sphere, a geoid, which maps the lands and oceans under the influence of Earth’s gravity. But gravity does not pull everywhere equally, turning the geoid into a bumpy ball.
“The paradox is that to use altimeter satellites to monitor our changing Earth, in particular ocean state changes, this Earth dynamically affects how accurately we can compute the satellite orbit,” Lemoine said. Defining Earth’s center of mass is like reaching a mirage. Earth is subtly and constantly changing shape. To measure changes in sea level, these shifts must be defined. “To measure the ocean surface, you need a stable reference frame,” Lemoine said.

A calculated change
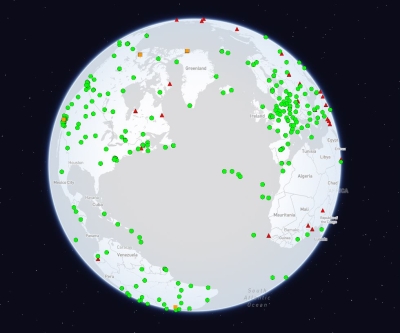
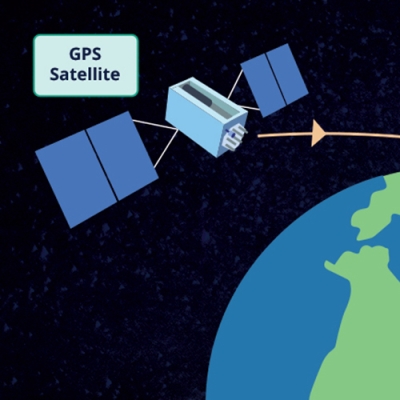
So for decades scientists have been refining the International Terrestrial Reference Frame (ITRF), a constellation of fixed reference points used to define Earth’s shape. The ITRF is derived from mathematical computations that use lasers, satellites, and radio telescopes to compare measurements and edit out errors. The network includes data from a high-precision network of Global Navigation Satellite System (GNSS) receivers, Satellite Laser Ranging (SLR), a French network of precise satellite tracking instruments called Doppler Orbit and Radiopositioning Integrated by Satellite (DORIS), and Very Long Baseline Interferometry (VLBI). When used together they increase accuracy. And an improvement to one component improves the overall ITRF.
The ITRF is the foundation of geodetic measurement accuracy. The heart of sea level measurements lies in precise orbit determination (POD), which relies on the ITRF’s tracking stations to measure the exact location of a satellite relative to the Earth’s center of mass. Each system within the ITRF has its strengths and weaknesses. For example, SLR ranging stations do not have good geographic coverage. They are mostly in the Northern Hemisphere, mostly on continents, and they do not pierce clouds well. DORIS complements SLR.
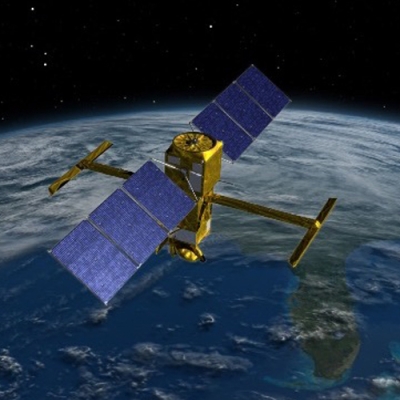
“When you have DORIS and SLR, for precise orbit determination, we see a good marriage providing much better orbit,” Zelensky said. DORIS peppers a series of beacons on Earth, and each beacon transmits two frequencies. Altimeter satellites such as TOPEX/Poseidon and Jason-3 have receivers that measure the change in each frequency, thus calculating the satellite’s velocity. Though the measurement is not as strong as SLR, it has a strong network geometry and functions in all types of weather.
Orbit error from POD is the largest component of sea level measurement inaccuracy. Altimeter satellites Jason-2 and Jason-3 have already reduced their orbit error to 1 centimeter (0.39-inch). So Zelensky focused on Satellite with Argos and Altika (SARAL), a French/Indian altimeter that maps the sea surface. SARAL contributes to the ITRF as part of the DORIS satellite constellation. If Zelensky could reduce SARAL’s orbit error to 1 centimeter, the ITRF could get a boost. “I think we’re pretty much there,” Zelensky said. To get there Zelensky and Lemoine used DORIS and SLR to better locate the receiver on SARAL. Knowing its shape and placement allowed them to include that geometry into models.

Infinite quest
Lemoine and Zelensky also wanted to improve the DORIS component of the ITRF. Every time a satellite moves over a beacon, DORIS measures the shift, revealing where the satellite is but also where that fixed reference on the surface of Earth begins. Zelensky and Lemoine had to account for a multitude of minute details. The geometrical shape of the satellite and where on the satellite the receiver actually resides make a difference in the calculations, as does the location of the face center, or height, on ground antennas. Even the delay of a signal as it travels through the atmosphere had to be corrected. The researchers’ efforts resulted in better station coordinates over a 22-year period to be added to an updated ITRF.
The ITRF gets adjusted every few years. A new realization was released earlier this year, extending the time span from 1979 to 2015, and providing more reference points with more accurate models that track station coordinates. “The ITRF is almost out of date the day it is created because there is a lag—time it takes to analyze the data—so it can be used for a while, a couple of years, but then the predictions degrade,” Lemoine said. Every time it gets reanalyzed a community of people implement improvements over the longest time series possible. For DORIS and SLR data, which are both archived at NASA's Crustal Dynamics Data Information System (CDDIS), the data stretch back to 1990 and 1976, respectively.
“The whole process of doing precision orbit modeling, whether it is for precise determination of altimeter satellites, figuring out where they are, or for determining fixed points on the ITRF, is a tremendously multi-disciplinary problem,” Lemoine said.
According to Pythagoras, a sixth century BCE philosopher and teacher, numbers are the essence and source of all things. Scientists continue to embrace mathematics to unlock the mysteries of the world. “I love the idea that you can measure this world. Through abstraction and mathematical modeling we have a window at better describing Earth,” Zelensky said.
Since ITRF stations are glued to Earth’s shifting crust, the ITRF needs to be continuously updated. “The problem is never going to go away, and the demands on accuracy are only going to increase,” Lemoine said. Though satellites help see the world, it is up to scientists to do the math.

References
Lemoine, F. G., D. S. Chinn, N. P. Zelensky, J. W. Beall, and K. Le Bail. 2016. The development of the GSFC DORIS contribution to ITRF2014. Advances in Space Research. doi:10.1016/j.asr.2015.12.043.
NASA Crustal Dynamics Data Information System (CDDIS). Satellite Orbit Predictions. Greenbelt, MD, USA. http://cddis.gsfc.nasa.gov/Data_and_Derived_Products/SLR/Orbit_predictions.html.
Zelensky, N. P., et al. 2016. Towards the 1-cm SARAL orbit. Advances in Space Research. doi:10.1016/j.asr.2015.12.011.
For more information
NASA Crustal Dynamics Data Information System (CDDIS)
International DORIS Service (IDS)
International Laser Ranging Service (ILRS)
International Terrestrial Reference Frame
| About the data | ||
|---|---|---|
| Platforms | Satellite Laser Ranging stations | Doppler Orbit and Radiopositioning Integrated by Satellite (DORIS) |
| Data set | Satellite Orbit Predictions | |
| Spatial extent | Bounding rectangle: (90.0 degree, -180.0 degree, -90.0 degree, 180.0 degree) | |
| Temporal coverage | 1976 to present | 1990 to present |
| Temporal resolution | 1 day | 1 day and multi-day |
| Parameters | Orbit predictions | Precise orbit determination |
| DAAC | NASA Crustal Dynamics Data Information System (CDDIS) | NASA CDDIS |