From the infamous Malibu to the quirky Venice, the beaches near Los Angeles (LA) bring out surfers come rain or shine. But surfers entering the waters during and after rainstorms expose themselves to more than just epic swells. Excessive bacteria in water, including fecal coliforms such as E. coli. and Enterococci, are associated with more than 600,000 gastrointestinal illnesses a year. A local environmental organization called Heal the Bay (HTB) monitors these beaches. They found that surfers are 20 percent more likely to get sick in the region’s wet winters compared to its dry summers.
Stormwater runoff is a major source of ocean pollution in LA and Southern California. The Southern California Bight (SCB), a curved coastline from Point Conception to San Diego, is home to nearly 25 percent of the coastal population in the United States. “We have millions of people surrounded by mountains,” said Benjamin Holt, a researcher at NASA's Jet Propulsion Laboratory (JPL) in Pasadena, California. “Anything you can think of that happens to be on the streets, enters the ocean—untreated.”
Holt has been keeping an eye on the ocean from high above. The native Californian has collected over two decades worth of satellite images of stormwater runoff into San Pedro and Santa Monica Bays to see how satellites could guide in situ water quality data collection and beach monitoring.
Assessing the impacts of stormwater runoff in coastal oceans commonly relies on sparse beach sampling and from onboard research vessels, but boat operations are costly and rain is sporadic. “Monitoring programs could do a lot more with respect to remote sensing,” said Michelle Gierach, another JPL researcher and coauthor of the study. By combining two different satellite sensors that image the ocean differently, Holt and his team hope to focus in situ sampling to the most polluted areas along the SCB coast.

Untreated and toxic
When the wet season arrives in late autumn in southern California, the reprieve from hot, dry summers is a sure welcome. The runoff, however, is not. Built-up trash and grime on the streets and in parking lots concentrate into the rivers that feed the ocean. Everything from cigarette butts, plastics, petroleum, pesticides, fertilizers, heavy metals, and fecal bacteria finds its way there. And with population increases and impervious surfaces spreading, ocean pollution is rising. “There’s so much concrete and asphalt in LA that rain water doesn’t go into the ground; it just runs off,” Holt said.
The LA river is part of the problem. Today it is more of a storm drain than a river. Once an alluvial river, slithering freely in the lush flood plain of southern California, it now inspires little of nature. In 1938, record-breaking rainfall inundated a third of the city, killing 115 people. The river carved new trenches, shifted nearly a mile in Compton, toppled bridges, and swept homes off the land. With this being the third major flood in 25 years, the US Army Corps of Engineers lowered and widened the river, cementing its banks and bottom for 278 miles. The river was unrecognizable. And it was not alone.
Holt’s study observed four rivers entering the San Pedro and Santa Monica Bays: the LA, San Gabriel, and Santa Ana Rivers, and Ballona Creek, with only the latter entering Santa Monica Bay. All these rivers are cemented. When the rains come and the rivers swell, water no longer reabsorbs into the soil, instead pollutants and debris accrue into these channels and out to the ocean.

Party pooper
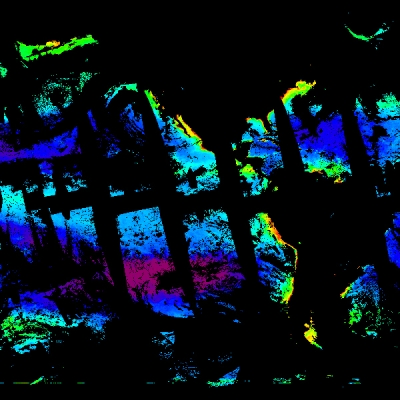
In the ocean, floating trash, leaves, silt, and other effluents dampen its wave height. Synthetic Aperture Radar (SAR) detects this smoothness, called a surface slick, when its radar sent to Earth bounces back weaker, appearing black in the grey-toned images. Since low winds and oil spills can also reduce wave height, Holt and his team verified whether their SAR plumes from 1992 to 2014 were truly from stormwater runoff with precipitation data. If rainfall exceeded 6 millimeters, they attributed the plumes to runoff.
According to the California Department of Public Health beaches should not exceed 104 colony-forming units/100 milliliters (cfu/ml) of Enterococci bacteria. Fecal bacteria in water are not necessarily harmful to humans themselves, but they tend to indicate the presence of pathogens, which can result in diarrhea, intestinal cramping, or skin rashes. Since testing for these pathogens is costly, agencies measure their fecal comrades instead.
Holt only matched two rain events of SAR data with Heal the Bay’s four-year beach sampling study, in December 2008 and February 2009. SAR data are patchy. Multiple satellites offer SAR data, but unfortunately, most do not have regular repeating acquisition schedules since they are mainly user-driven, meaning the data coverage is sporadic. This makes it hard to match SAR data with likewise sporadic rainfall in southern California. In either case, the plume examples corresponded well with fecal contamination. Where there was a plume, there was a problem.
“The patterns were quite good,” Holt said. Harmful fecal concentrations occur most often within one to two days of rainstorms, but not always. Three rivers flow into San Pedro Bay: the LA, San Gabriel, and Santa Ana Rivers. On December 15, 2008 a deluge began. HTB measured contamination levels at the mouths of three rivers, where the worst bacteria levels are typically detected. Three rivers flow into San Pedro Bay: the LA, San Gabriel, and Santa Ana Rivers. On that first day of the storm, both the Santa Ana and San Gabriel Rivers had safe levels of Enterococci bacteria, while the LA River had dangerous levels. According to SAR data, no plume developed near or offshore the Santa Ana, validating the results. On December 17, high levels of bacteria were only detected in Ballona Creek and the Santa Ana River.
SAR data offer fine resolution imagery which is able to capture images close to shore. The suggested key observation from this limited overlapping data sets is that harmful bacteria levels appear to be observed only within the SAR-detected plume extent. For Holt, using SAR data provides a unique capability for agencies concerned with stormwater contamination. He added, “Using SAR is a way to decide where to sample most effectively.”

City slicker
Holt also knew SAR had its limitations, so he contacted Gierach, who specializes in ocean color sensors, such as the Moderate-Resolution Imaging Spectroradiometer (MODIS) on NASA's Aqua satellite. By incorporating another characteristic of stormwater runoff—the sediment discharge—could more insights be made on stormwater runoff in southern California?
Cloud cover during or after storms limits MODIS, and with SAR data being sporadic, only seven rainstorms matched up MODIS and SAR imagery, offering the researchers a comparison of how each instrument sees the coastal ocean.
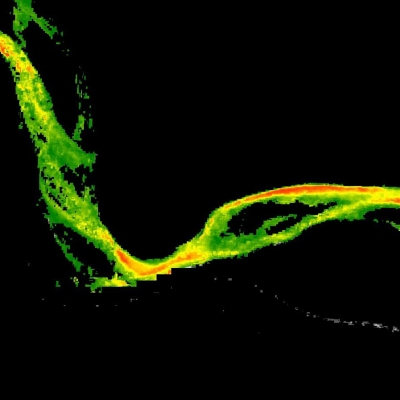
MODIS detects turbidity, or the water’s cloudiness. “With these major precipitation events, a lot of material is being dumped into the ocean that would be characteristically different than the surrounding waters,” Gierach said. “We’re not specifically teasing out this or that pollutant. We’re just saying we know that this water mass is entirely different.” The MODIS sediment plumes were considerably larger than the SAR surface slick plumes. The signature from SAR images is generally smaller in size and is observed for a shorter period since the surface plume eventually mixes and spreads out into the ocean. Thought trash and debris may still be present, diluted concentrations are less able to dampen ocean waves. Since MODIS picks up larger plumes, anyone interested in offshore testing can target a larger contaminated area.
On the other hand, SAR snaps images at night and during a rainstorm, when considerable cloud coverage blocks the MODIS sensor, allowing SAR to always be the first to detect stormwater runoff plumes.
SAR, coupled with MODIS, fill each other’s gaps. “Clearly there are some limitations,” Gierach said. But knowing the caveats associated with each instrument should not be a deterrent in using them. “There are limitations, but the information you can get by a combination of remote sensing sensors is still so key that I think it outweighs the limitations,” she added.
As for the LA River, reducing the contaminants from industrial sites, catching larger items like branches and plastic cups in catchment areas, could help abate toxic and harmful matter from entering the ocean. Exposing more soil to retain rain is another solution, but this option has to be weighed carefully since a major city stands in the river’s way. Recently, an agreement between LA and the federal government hopes to revitalize the LA River with a $1.3 billion restoration effort, covering an 18-kilometer (11-mile) stretch, where concrete encasements will be removed to green up the river and create an urban oasis with a bike path, parks, and business.
Still, ocean-borne illnesses, according to LA County health officials, cause $20 million dollars annually in health-related costs. In the end, whether the goal is healthier beaches, improving public health, successful wastewater diversions, or ocean monitoring, Gierach envisions more pairings between specific agencies, their needs, and NASA data. “The true merit of remote sensing should be advocated more broadly to engage specific agencies,” Gierach said.

For more information
NASA Alaska Satellite Facility Distributed Active Archive Center (ASF DAAC)
NASA Ocean Biology DAAC (OB.DAAC)
Japan Aerospace Exploration Agency (JAXA) Advanced Land Observing Satellite (ALOS)
JAXA Phased Array type L-Band Synthetic Aperture Radar (PALSAR)
NASA Moderate Resolution Imaging Spectroradiometer (MODIS)
Synthetic Aperture Radar (SAR)
References
Gierach. M., B. Holt, R. Trinh., B. Pan, and C. Rains. 2016. Satellite detection of wastewater diversion plumes in Southern California. Estuarine, Coastal and Shelf Science. doi:10.1016/j.ecss.2016.10.012.
Holt, B., R. Trinh, and M. M. Gierach. 2017. Stormwater runoff plumes in the Southern California Bight: A comparison study with SAR and MODIS imagery. Marine Pollution Bulletin 118: 141-154. doi:10.1016/j.marpolbul.2017.02.040.
NASA Alaska Satellite Facility Distributed Active Archive Center (ASF DAAC). 2017. ALOS PALSAR data. Copyrighted by JAXA, METI. Fairbanks, AK, USA: NASA ASF DAAC. https://www.asf.alaska.edu/sar-data/palsar/about-palsar.
NASA Alaska Satellite Facility Distributed Active Archive Center (ASF DAAC). 2017. Uninhabited Aerial Vehicle Synthetic Aperture Radar (UAVASAR) data. Fairbanks, AK, USA. https://www.asf.alaska.edu/sar-data/uavsar/
NASA Goddard Space Flight Center, Ocean Ecology Laboratory, Ocean Biology Processing Group. 2017. Moderate-resolution Imaging Spectroradiometer (MODIS) Aqua Ocean Color Data. NASA Ocean Biology Distributed Active Archive Center (OB.DAAC), Greenbelt, MD, USA. doi:10.5067/AQUA/MODIS/L2/OC/2018/
| About the remote sensing data | |||
|---|---|---|---|
| Satellites | Aqua | Japan Aerospace Exploration Agency (JAXA) Advanced Land Observing Satellite (ALOS) |
|
| Platform | NASA Gulfstream III (G-III) Research Testbed Aircraft | ||
| Sensors | Moderate Resolution Imaging Spectroradiometer (MODIS) |
Phased Array type L-Band Synthetic Aperture Radar (PALSAR) |
Uninhabited Aerial Vehicle Synthetic Aperture Radar (UAVSAR) |
| Data sets | |||
| Resolution | 555 nanometers | 100 meters | 7 meters |
| Parameters | Ocean color/reflectance | Reflectance | Reflectance |
| DAACs | NASA Ocean Biology Distributed Active Archive Center (OB.DAAC) | NASA Alaska Satellite Facility DAAC (ASF DAAC) | NASA ASF DAAC |