When it comes to capturing data over a large area, satellites are ideal, especially if you are interested in seeing that area in its entirety at the same time over a period of weeks, months, or years. But what if you're interested in getting time series data for a specific place (or small number of places)? Would satellite observations still be your best bet, or would it make more sense to use in situ methods of data collection? Further, what if those places were in remote areas with difficult terrain? Which data access method would you choose?
These aren't hypothetical questions, as scientists working in a range of disciplines often need data for specific places over long periods of time. Hydrologists, for example, often use stream gauges at individual monitoring stations to track water levels at regular intervals, generating time-series data of stream height. They might also measure the amount of moisture in the soil at a specific location, even though the measurement might determine amounts of soil moisture at several different depths below the surface. Both of these examples pertain to what scientists call point data; that is, data measured at a specific geographical point on Earth's surface.
To more efficiently use data acquired by satellite-borne sensors for point data observations, scientists have developed a variety of methods to generate location-specific time series data. One of the cleverest is through the use of data rods.
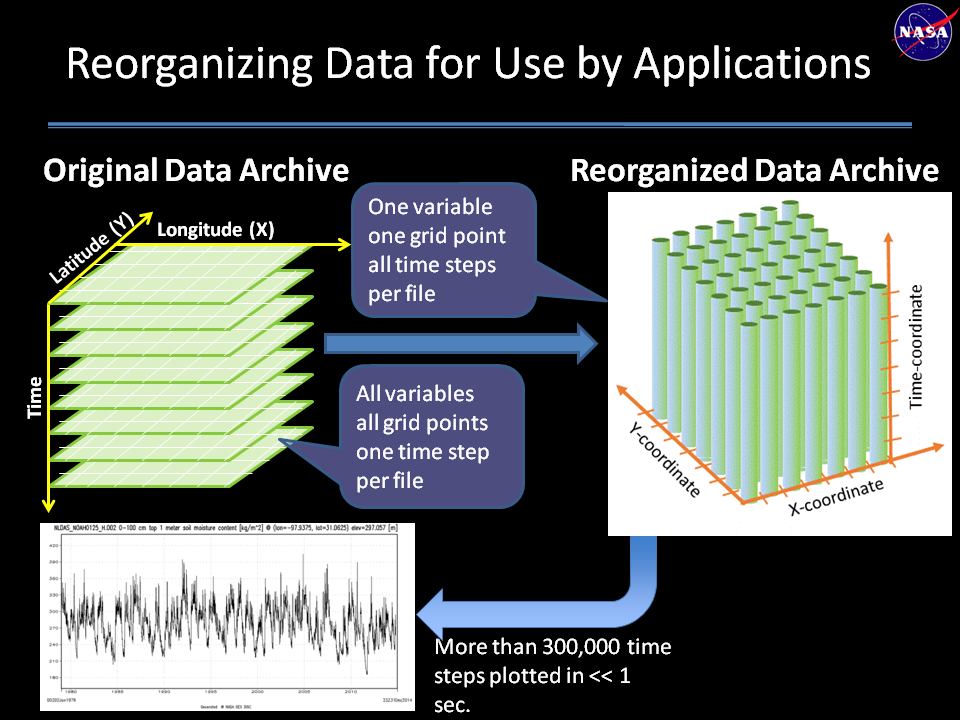
Data rods are created from daily or monthly satellite observations where the data have been rearranged so that they provide faster access to time-series data with a large number of time stamps. The image below illustrates this process.
To assist members of the hydrological community in developing their own time-series datasets for specific locations, the Goddard Earth Sciences Data and Information Services Center (GES DISC) launched and operationalized a data rods project with the support of the Advancing Collaborative Connections for Earth System Science (ACCESS) program. ACCESS is a competitive awards program managed by NASA's Earth Science Data Systems (ESDS) Program that develops and implements technologies to effectively manage, discover, and use NASA's archive of Earth observations for scientific research and applications.
The GES DISC data rods ACCESS project had two primary goals:
- Reorganize two large hydrological datasets as time series for more efficient access by the Consortium of Universities for the Advancement of Hydrologic Science, Inc. (CUAHSI) and the larger hydrology community
- Integrate these time-series data (as data rods) into established hydrology community tools, such as the CUAHSI Hydrologic Information System (CUAHSI-HIS), the U.S. Environmental Protection Agency's (EPA) Better Assessment Science Integrating Point and Non-point Sources (BASINS) environmental analysis system, and the Data Rods Explorer on HydroShare's Tethys Platform
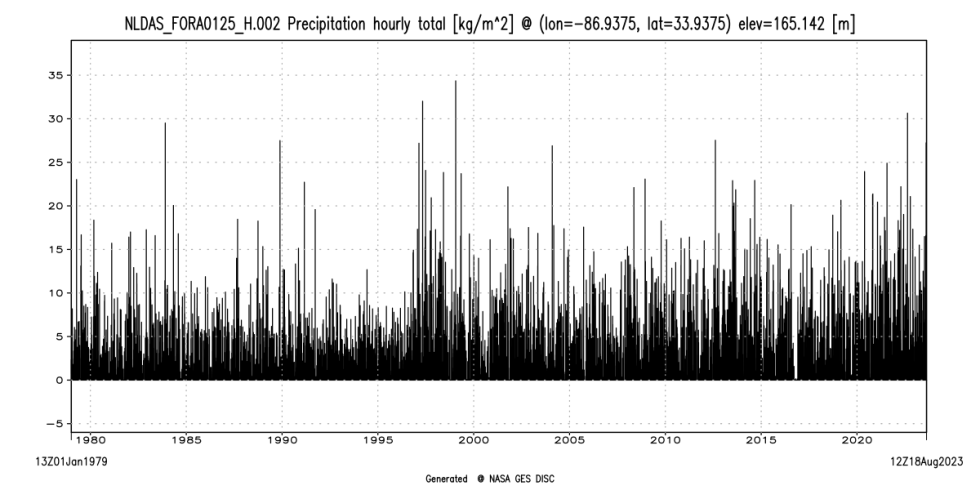
GES DISC's data rods contain data for various water cycle variables obtained from the North American Land Data Assimilation System (NLDAS) and the Global Land Data Assimilation System (GLDAS), and cover the time periods of 1979-present and 2000-present, respectively. Users can extract a time series for a specific period simply by specifying the start date, the end date, and a location. In addition, users also can access high-resolution time-series data from the Integrated Multi-satellitE Retrievals for GPM (IMERG) Final Precipitation Level 3 half hourly product featuring more than 100,000 time stamps.
“The [Data Rods for Hydrology] tool provides fast access to time-series data along with a time-series graph, and avoids the need to download the data, as it provides data in ASCII format,” said Dr. Binita KC, user needs lead at GES DISC. “[Data rods] solve the problem users face when trying to create time series of the NLDAS hourly forcing precipitation data for single grid cells for the entire period of coverage.”
Prior to the creation of data rods, users would have to subset data for the parameters they were interested in at the appropriate latitude and longitude, and then download those files at one time-step per file. With a dataset that has a three-hourly temporal resolution, the number of files adds up quickly. Now, as long as users know the parameter they want to examine, the latitude and longitude of the point, and the length of time they want to study, they can query one of these data rods and retrieve all the data they need—remarkably fast.
Users can find a link to the Data Rods for Hydrology tool at the bottom of the GES DISC website home page (under the Tools heading). The Hydrology Data Rods page describes the data rods time series service and features three tables:
- Table 1 lists variables reorganized as a time series (data rods) along with sample URLs of the web service for each variable; the web service currently accepts five keywords: variable, location, startDate, endDate, and type
- Table 2 describes the Key-Value-Pair (KVP) syntax of the web service. The startDate and endDate are optional; the date/time of the first and last time steps, respectively, are the default values. All sample URLs for "plot" that do not specify startDate ;and endDate return a time series of the entire date range
- Table 3 describes the basic characteristics of NLDAS and GLDAS data
Users can also access GES DISC's Hydrology Data Rods via an Application Programming Interface (API), such as the one provided in the tutorial How to Access the Hydrology Data Rods Time Series API Using Python.
Located at NASA's Goddard Space Flight Center in Greenbelt, Maryland, GES DISC is one of 12 discipline-specific Distributed Active Archive Centers (DAACs) in NASA's Earth Observing System Data and Information System (EOSDIS). GES DISC manages, archives, and distributes data, tools, and resources pertaining to the areas of atmospheric composition, atmospheric dynamics, global precipitation, and solar irradiance. In addition, GES DISC supports data from many heritage and NASA Earth Observing System (EOS) satellite missions including Aqua and Aura, the Tropical Rainfall Measuring Mission (TRMM), the Solar Radiation and Climate Experiment (SORCE), the Upper Atmosphere Research Satellite (UARS), and Earth Probe/Total Ozone Mapping Spectrometer-Earth Probe (TOMS-EP). GES DISC also provides services for data subsetting, exploration, visualization, and access. GES DISC datasets can be accessed through Earthdata Search and the GES DISC website.
Learn More
NASA Earthdata webinar: Access NASA GES DISC Meteorological and Hydrological Data for Flood Analyses


