On Sunday, July 16, 2023, sea surface temperatures around Florida “reached the highest levels on record,” with readings in some areas as high as 97ºF.
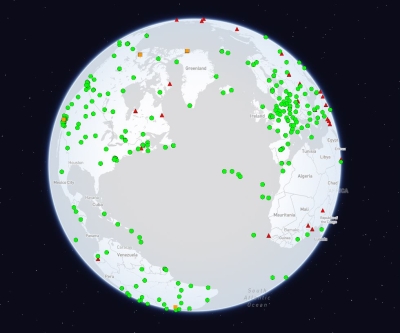
How out of the ordinary are such ocean temperatures? To find out, you’d need to look at sea surface temperature anomaly data, which show the difference between current temperatures and the long-term average. The easiest way to do this is to visit the State of the Ocean (SOTO) online tool.
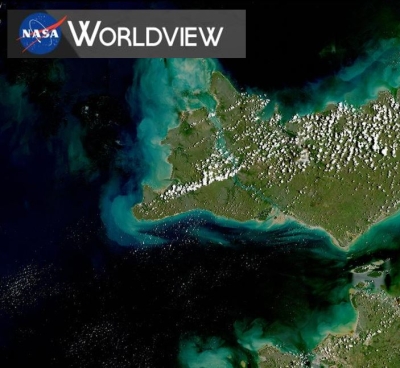
Developed by NASA’s Physical Oceanography Distributed Active Archive Center (PO.DAAC) and powered by NASA Worldview, SOTO provides access to a broad range of satellite-derived, ocean-focused data products and facilitates scientific oceanographic, climate, and related research.
“SOTO is a web-based user interface that allows you to visualize various scientific data products, with a focus on oceanographic-related datasets,” said Frank Greguska, a PO.DAAC scientific applications software engineer and the SOTO development lead. “It allows users to get a quick look at the data very easily, while also enabling exploratory analysis.”
SOTO allows users to:
- Visualize physical oceanography data products for near real-time monitoring of critical ocean parameters and decision support
- Access a broad range of satellite-derived products of interest to the oceanographic community (i.e., productivity, salinity, sea surface height) in NASA’s Earth Observing System Data and Information System (EOSDIS) archive
- Discover and analyze oceanographic data products to enable scientific oceanographic, climate, and related research
SOTO’s visualizations of oceanographic satellite datasets center on three parameters: chlorophyll a, sea surface temperature, and sea surface temperature anomaly.
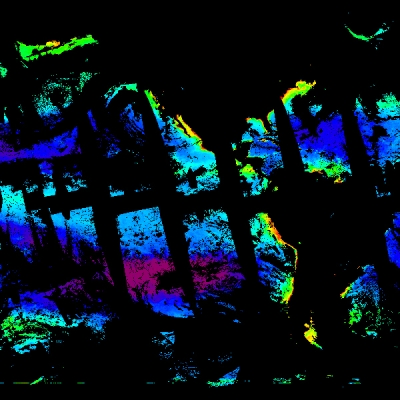
The Chlorophyll a data layer, sourced from a Level 2 product created with data from the Moderate Resolution Imaging Spectroradiometer (MODIS) instrument aboard NASA’s Aqua and Terra satellites, provides the near-surface concentration of chlorophyll a in milligrams of chlorophyll pigment per cubic meter (mg/m3). Chlorophyll is a light-harvesting pigment found in most photosynthetic organisms; in the ocean, phytoplankton all contain the chlorophyll pigment, which has a greenish color. The concentration of chlorophyll a is used as an index of phytoplankton biomass, and because changes in the amount of phytoplankton indicate the change in productivity of the ocean, it is a useful measure for assessing ocean health. In addition, chlorophyll features can also be used to trace oceanographic currents, atmospheric jets, upwelling and downwelling, and river plumes.
SOTO’s Sea Surface Temperature (SST) and Sea Surface Temperature Anomaly layers are created with data from the Group for High Resolution Sea Surface Temperature (GHRSST) Multiscale Ultrahigh Resolution (MUR) Level 4 Global Foundation Sea Surface Temperature Analysis (v4.1) product. These layers are critical to oceanographic research as changes in sea surface temperature impact weather, oceanic and atmospheric current patterns, ocean ecology, and even life on land. Sea surface temperatures are normally warmer near the equator and cooler near the poles, but ocean currents move warm and cold water around Earth’s oceans. When these currents flow near the surface, they are typically visible in sea surface imagery when not obscured by clouds.

“From the science perspective, the relationship between SST and chlorophyll is an important one for understanding biodiversity. Therefore, the coupling between these two parameters gave a strong reason for being able to visualize them jointly as data layers and for different regions of the world’s ocean,” said Dr. Jorge Vazquez, a research scientist with NASA's Jet Propulsion Laboratory (JPL) in Southern California. “Also, SST anomaly along with sea level clearly define El Niño and La Niña conditions in the Equatorial Pacific. Therefore, being able to visualize changing SST anomalies in the Tropical Pacific provides a tool for monitoring the development of El Niño and La Niña conditions.”
Of course, monitoring the state of the ocean involves more than tracking these three parameters. This is why SOTO allows users to visualize a number of other ocean-related data products—salinity, precipitation, wind speed, and sea surface height—and offers unique features, like giving users the ability to change the maximum and minimum values on parameter color bars, which provides extra flexibility for comparing data layers and examining the space-time variability in different regions.
PO.DAAC released the initial version of SOTO in 2011. Although the tool has changed quite a bit since its release, the idea on which the tool was built has not.
“There has always been this idea of SOTO being an entry point into the data,” said Greguska. “It aims to be simple enough so it can be understood by the general public and used as an outreach tool, but it also has some slightly more advanced capabilities that a researcher could find useful as a way of sparking areas of interest that they may want to dive into with a research question.”
Vazquez concurs, and said that as the technology underpinning SOTO improves, so does the tool.
“SOTO was specifically developed as an interface to allow users to visualize operational remote sensing products. The rationale was to provide an intuitive interface to visualize oceanographic data for applications and decision support,” he said. “In the beginning, there were no requirements about extracting or downloading the data, but in the data layer descriptions, users were pointed to pages on the PO.DAAC website that described how to download the products.”
SOTO has added new services since then—users can now access the data products directly from the information about each of SOTO’s data layers—and it continues to evolve. In fact, PO.DAAC released a version of SOTO in December 2022 that capitalizes on the DAAC’s migration of the data it distributes to the Earthdata Cloud. This new iteration benefits users through improved efficiency in its data systems operations and greater access to the wider collection of NASA Earth science datasets and services.
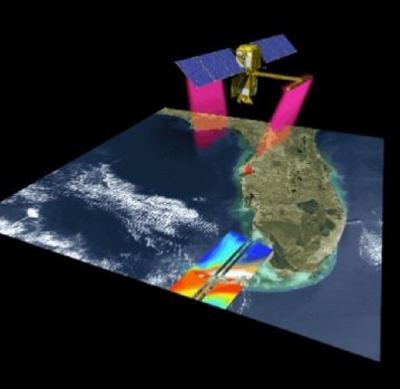
"The services offered by SOTO will be advantageous for the newly launched flagship mission, SWOT [Surface Water and Ocean Topography], with its massive downlink data volume of 20 terabytes per day," said Dr. Jinbo Wang, PO.DAAC project scientist and SWOT scientist. "Having an efficient means of accessing the data through SOTO will significantly enhance the pace of scientific discoveries and facilitate the development of applications.”
Located at NASA's JPL, PO.DAAC manages and provides tools and services for NASA's oceanographic and hydrologic data (satellite, airborne, and in situ) to enable greater understanding of the physical processes and condition of the global ocean. Measurements include gravity, ocean winds, sea surface temperature, ocean surface topography, sea surface salinity, and circulation. These data support a wide range of applications including climate research, weather prediction, resource management, policy, and the stewardship of ocean data resources.
Learn More
NASA PO.DAAC's State Of The Ocean (webinar)