Carbon Dioxide
Image
.")
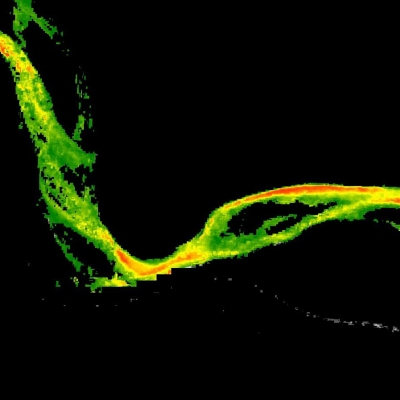
Carbon dioxide (CO2) is an important greenhouse gas that is released through human activities such as burning fossil fuels and deforestation as well as through natural processes such as plant respiration and volcanic eruptions. Once CO2 is added to the atmosphere, it persists for 300 to 1,000 years. Humans have increased the amount of CO2 in the atmosphere by about 47% since the Industrial Revolution began.
Note: An Earthdata Login is required to download data from Earthdata Search and for full Giovanni functionality.
Satellite Data
- Orbiting Carbon Observatory-2 (OCO-2)
Launched in July 2014, OCO-2 makes roughly 100,000 global measurements of atmospheric column CO2 concentrations every day. Measurements from OCO-2 have been used to better understand land and ocean fluxes of CO2 and the global carbon cycle. -
Orbiting Carbon Observatory-3 (OCO-3)
Launched in May 2019, the OCO-3 instrument aboard the International Space Station measures and maps column CO2 in great detail, improving our understanding of the interaction between carbon and climate, particularly in urban environments. -
Atmospheric Infrared Sounder (AIRS)
The AIRS instrument aboard NASA’s Aqua satellite (launched in 2002) provides 3D measurements of temperature, water vapor, trace gases, and surface and cloud properties through the atmospheric column. The AIRS CO2 Standard Retrieval Product consists of retrieved estimates of CO2 more representative of the mid-to-upper troposphere, plus estimates of the errors associated with the retrieval. AIRS data are available in daily and monthly temporal resolutions.- AIRS CO2 data from Earthdata Search
- AIRS CO2 data can be visualized and explored using a NASA web-based interactive tool called Giovanni. Learn more about Giovanni in Tools for Data Access and Visualization.
-
Tropospheric Emission Spectrometer (TES)
TES is an instrument aboard the joint NASA/multi-national Aura satellite that launched on July 15, 2004. TES measured the state and composition of the troposphere, the lowest layer of Earth's atmosphere. While TES was not originally designed to measure CO2, a team at NASA's Jet Propulsion Laboratory in Pasadena, California, developed and validated a TES CO2 tool. Data collection for TES was completed in January 2018.
Airborne Data
-
Carbon in Arctic Reservoirs Vulnerability Experiment (CARVE)
CARVE is an Earth Venture Suborbital-1 (EVS-1) mission funded in 2010 as part of NASA's Earth System Science Pathfinder (ESSP) Mission. From 2011 through 2015, CARVE collected detailed measurements of greenhouse gases in the Alaskan Arctic and developed models to quantify Arctic carbon fluxes and carbon cycle-climate processes. CARVE provides an integrated set of greenhouse gas data that provide experimental insights into Arctic carbon cycling. -
Atmospheric Tomography Mission (ATom)
ATom is a NASA Earth Venture Suborbital-2 (EVS-2) mission to study the impact of human-produced air pollution on greenhouse gases and on chemically reactive gases in the atmosphere. ATom deployed an extensive gas and aerosol payload on NASA's DC-8 aircraft for systematic, global-scale sampling of the atmosphere, profiling continuously from 0.2 to 12 km altitude. Around-the-world flights were conducted in each of the four seasons between 2016 and 2018. -
Atmospheric Carbon and Transport - America (ACT-America)
ACT-America is a NASA EVS-2 mission that studied the transport and fluxes of atmospheric CO2 and methane (CH4). Starting in the summer of 2016, ACT-America conducted five airborne campaigns across three regions in the Eastern United States to study the transport and fluxes of these two gases. The final campaign concluded in the summer of 2019. -
Arctic Boreal Vulnerability Experiment (ABoVE)
In 2017, NASA's ABoVE used aircraft equipped with the Airborne Visible Infrared Imaging Spectrometer - Next Generation (AVIRIS-NG) instrument to fly over 11,583 mi2 (30,000 km2) of the Arctic landscape to measure carbon monoxide (CO), CO2, CH4, and water vapor (H2O) concentrations.
Ground Data
-
Database of Road Transportation Emissions (DARTE)
The DARTE dataset provides a 38-year inventory of annual on-road CO2 emissions for the conterminous United States. The dataset is 1 km resolution and is based on roadway-level vehicle traffic data and state-specific emissions factors for multiple vehicle types on urban and rural roads. -
North American Carbon Program (NACP)
The NACP is a multidisciplinary research program designed to improve our understanding of North America's carbon sources, sinks, and stocks. NACP compiles data from the following independent atmospheric monitoring networks: Advanced Global Atmospheric Gases Experiment, Comprehensive Oculomotor Behavioral Response Assessment, Commonwealth Scientific and Industrial Research Organization, Intercontinental Chemical Transport Experiment-A (INTEX-A), INTEX-B, Irvine Latitude Network, NOAA Climate Monitoring and Diagnostics Laboratory, Scripps, and Stanley Tyler-UC Irvine. While the primary focus of this effort was the compilation of non-CO2 greenhouse gases over North America, numerous CO2 observations are also included. The NACP is supported by a number of different federal agencies. -
Vulcan
The Vulcan project provides estimates of CO2 emissions from the combustion of fossil fuels and from cement production for the conterminous United States and the state of Alaska. The emissions data from Vulcan are categorized into 10 source sectors, including residential, commercial, industrial, electricity production, on-road, non-road, commercial marine vessel, airport, rail, and cement. Data are gridded annually on a 1 km grid for the years 2010 to 2015. -
Coastal Wetland Elevation and Carbon Flux Inventory
The Coastal Wetland Elevation and Carbon Flux Inventory dataset provides maps of coastal wetland carbon and CH4 fluxes and coastal wetland surface elevation from 2006 to 2011 at 30 m resolution for coastal wetlands of the conterminous United States. Total coastal wetland carbon flux per year per pixel was calculated by combining maps of wetland type and change with soil, biomass, and CH4 flux data from a literature review.
Model Data
-
ECCO-Darwin Model v5
The Estimating the Circulation and Climate of the Ocean (ECCO)-Darwin model is the first global ocean biogeochemistry model that ingests both physical and biogeochemical observations into the model in a realistic manner and considers how the nature of the ocean carbon sink has changed over multiple decades.
-
CASA-GFED3 Land Carbon Flux
This dataset presents a variety of carbon flux parameters derived from the Carnegie-Ames-Stanford-Approach—Global Fire Emissions Database version 3 (CASA-GFED3) model. The model’s input data include air temperature, precipitation, incident solar radiation, a soil classification map, and a number of satellite-derived products. All model calculations are driven by analyzed meteorological data from NASA’s Modern-Era Retrospective analysis for Research and Application, Version 2 (MERRA-2). The resulting product provides monthly, global data at 0.5 degree resolution from January 2003 through December 2017.
-
OCO-2 GEOS Column CO2 Concentrations
The Orbiting Carbon Observatory-2 (OCO-2) is an exploratory science mission designed to collect space-based global measurements of atmospheric CO2 with the precision, resolution, and coverage needed to characterize sources and sinks (fluxes) on regional scales (≥1000 km). This dataset provides global gridded, daily column-averaged carbon dioxide (XCO2) concentrations from January 1, 2015 to February 28, 2022. The data are derived from OCO-2 observations that were input to the Goddard Earth Observing System (GEOS) Constituent Data Assimilation System (CoDAS), a modeling and data assimilation system maintained by NASA’s Global Modeling and Assimilation Office (GMAO).
-
OCO-2 MIP Top-down CO2 Budgets
Inverse modeling (“top-down”) is used to enable estimation of annual net CO2 emissions and removals (uptake) in units of grams of CO2 per square meter per year (g CO2/m2/yr). This Orbiting Carbon Observatory (OCO-2) modeling intercomparison project (MIP) Top-down CO2 Budget dataset is the result of a collaboration between an international group of over 60 researchers and atmospheric modelers to study the impact of assimilating OCO-2 retrieval data into atmospheric inverse models..
-
ODIAC Fossil Fuel CO2 Emissions
The Open-source Data Inventory for Anthropogenic CO2 (ODIAC) data product is a monthly high-resolution global data product of modeled fossil fuel CO2 emissions. The ODIAC estimated global spatial extent of fossil fuel CO2 emissions is produced on a 1 km x 1 km grid that details variations in urban regions where emissions are most intense.
Methane
Image
.")
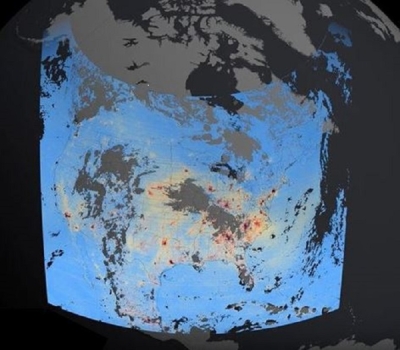
Methane (CH4) is much less abundant in the atmosphere than CO2, but it’s also more powerful. On a per-pound-basis, CH4 is 30 times more powerful than CO2 at trapping heat over 100 years, which makes it the second most important human-caused greenhouse gas. Sources of methane emissions include livestock production, rice fields, oil and gas production, landfills, biomass burning, and natural sources such as microbial processes in wetlands. Methane concentrations are now 150% higher than in the mid-19th century.
Note: An Earthdata Login is required to download data from Earthdata Search and for full Giovanni functionality.
Satellite Data
-
AIRS instrument
The AIRS instrument aboard NASA’s Aqua satellite (launched in 2002) provides 3D measurements of temperature, H2O, trace gases, and surface and cloud properties through the atmospheric column. AIRS data are available daily or monthly.- AIRS CH4 data from Earthdata Search
- AIRS CH4 data can be visualized and explored using a NASA web-based interactive tool called Giovanni. Learn more about Giovanni in Tools for Data Access and Visualization.
-
TES
TES is an instrument aboard NASA's Aura satellite and was launched on July 15, 2004. TES provided measurements of O3, H2O, CO, CH4, N2O, and nitric acid (HNO3) for 16 orbits every other day. Data collection for TES was completed in January 2018. TES data are available in daily and monthly averages. -
Sentinel-5P Tropospheric Monitoring Instrument (TROPOMI)
Launched in 2017, the Copernicus Sentinel-5 Precursor (Sentinel-5P) satellite is a mission run by the European Space Agency (ESA). TROPOMI is the sole instrument aboard the satellite. TROPOMI has a short-wave infrared (SWIR) band that allows the detection of CH4 and CO. -
Earth Surface Mineral Dust Source Investigation (EMIT)
Launched on July 14, 2022, and installed on the International Space Station, EMIT can map areas of high methane concentrations over background levels in the atmosphere, identifying plume complexes, and estimating the methane enhancements.
Airborne Data
-
Arctic Boreal Vulnerability Experiment (ABoVE)
In 2017, NASA's ABoVE used aircraft equipped with the AVIRIS-NG instrument to fly over 11,583 mi2 (30,000 km2) of the Arctic landscape to measure methane concentrations. -
Methane Sources, Vista California and the California Methane Survey
The Vista California datasets provide locations of potential CH4 emitting facilities and infrastructure across the state of California created from an assortment of publicly available data sources from local, state, and federal agencies for the years 2005 to 2019. Often referred to collectively as Vista-CA, these data consist of detailed spatial maps for facilities and infrastructure in California that are known or expected sources of CH4 emissions and illustrate the spatial distribution of potential CH4 sources. The final Vista-CA database contains over 900,000 entries, which are presented as 15 methane-emitting infrastructure maps. The database is instrumental to the California Methane Survey, an ongoing project to measure CH4 emissions in California with the AVIRIS-NG instrument. -
CARVE
CARVE is an Earth Venture Suborbital-1 (EVS-1) mission funded in 2010 as part of NASA's ESSP Mission. From 2011 through 2015, CARVE collected detailed measurements of greenhouse gases in the Alaskan Arctic and developed models to quantify Arctic carbon fluxes and carbon cycle-climate processes. CARVE provides an integrated set of greenhouse gas data that provide experimental insights into Arctic carbon cycling. -
ACT-America
ACT-America is a NASA EVS-2 mission that studied the transport and fluxes of atmospheric CO2 and CH4. Starting in the summer of 2016, ACT-America conducted five airborne campaigns across three regions in the Eastern U.S. to study the transport and fluxes of these two gases. -
ATom
ATom is a NASA EVS-2 mission to study the impact of human-produced air pollution on greenhouse gases and on chemically reactive gases in the atmosphere. ATom deployed an extensive gas and aerosol payload on NASA's DC-8 aircraft for systematic, global-scale sampling of the atmosphere, profiling continuously from 0.2 to 12 km altitude. Around-the-world flights were conducted in each of the four seasons between 2016 and 2018.
Model Data
-
GOSAT-based Top-down Total and Natural Methane Emissions
The NASA Carbon Monitoring System Flux (CMS-Flux) team used remote sensing observations from Japan’s Greenhouse gases Observing SATellite (GOSAT) to produce modeled total CH4 emissions and uncertainties on a 1 degree x 1 degree resolution grid for the year 2019. The GOSAT data are used in the model to inform total emission estimates as well as wetland (the primary natural source of methane) and various human-related sources such as fossil fuel extraction, transport, agriculture, waste, and fires. An advanced mathematical approach is used with a global chemistry transport model to quantify annual CH4 emissions and uncertainties. These estimates are expressed in teragrams of CH4 per year (Tg/yr).
-
TM5-4DVar Isotopic CH4 Inverse Fluxes
This dataset presents monthly methane emissions from microbial, fossil and pyrogenic sources, along with a layer of total methane emissions from all three sources combined, at 1° resolution from 1999 to 2016.
-
Wetland Methane Emissions, LPJ-wsl Model
The LPJ-wsl Wetland Methane Emissions data product consists of global daily and monthly model estimates of terrestrial wetland CH4 emissions from 1980 to 2021. These data are regularly used in conjunction with NASA’s Goddard Earth Observing System (GEOS) model to simulate the impact of wetlands and other methane sources on atmospheric methane concentrations, to compare against satellite and airborne data, and to improve understanding and prediction of wetland emissions.
Nitrous Oxide
Image
 instrument.")
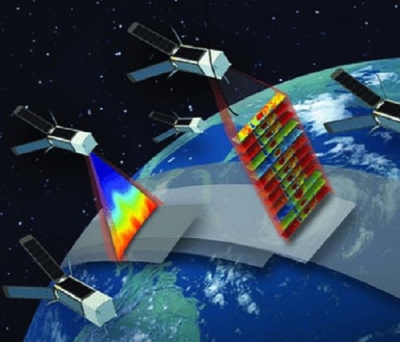
Nitrous oxide (N2O) is a powerful greenhouse gas that is about 100 times more potent per pound than carbon dioxide (CO2) over 100 years. N2O is emitted from agricultural soil management, the combustion of fossil fuels, industrial activities, and manure management. N2O is also a stratospheric-ozone-depleting substance.
Satellite Data
-
Microwave Limb Sounder (MLS)
The MLS instrument aboard NASA's Aura satellite makes measurements of atmospheric composition, temperature, humidity, and cloud ice that are needed to track the stability of the stratospheric ozone layer, help improve predictions of climate change and variability, and help improve our understanding of global air quality. Near real-time (NRT) N2O data are available through NASA's Land, Atmosphere Near real-time Capability for EOS (LANCE). -
TES
TES is an instrument aboard NASA's Aura satellite, which launched on July 15, 2004. TES provided measurements of O3, H2O, CO, CH4, N2O, and HNO3 for 16 orbits every other day. Data collection for TES was completed in January 2018. -
High Resolution Dynamics Limb Sounder (HIRDLS)
Launched in 2004, HIRDLS is an instrument aboard NASA's Aura satellite. The science goals of HIRDLS were to observe global distribution of temperature and concentrations of O3, H2O, CH4, N2O, NO2, HNO3, dinitrogen pentoxide (N2O5), CFC-11, CFC-12, and chlorine nitrate (ClONO2). After launch, activation of the HIRDLS instrument revealed that the optical path was blocked so that only 20% of the aperture could view Earth's atmosphere. However, even with the blockage, measurements at high vertical resolution could be made at one scan angle. HIRDLS stopped recording observations in March 2008.
Airborne Data
-
ATom
ATom is a NASA EVS-2 mission to study the impact of human-produced air pollution on greenhouse gases and on chemically reactive gases in the atmosphere. ATom deployed an extensive gas and aerosol payload on NASA's DC-8 aircraft for systematic, global-scale sampling of the atmosphere, profiling continuously from 0.2 to 12 km altitude. Around-the-world flights were conducted in each of the four seasons between 2016 and 2018. -
ACT-America
ACT-America is a NASA EVS-2 mission that studied the transport and fluxes of atmospheric CO2 and CH4. Starting in the summer of 2016, ACT-America conducted five airborne campaigns across three regions in the Eastern United States to study the transport and fluxes of these two gases. The final campaign concluded in the summer of 2019.
Ozone
Image

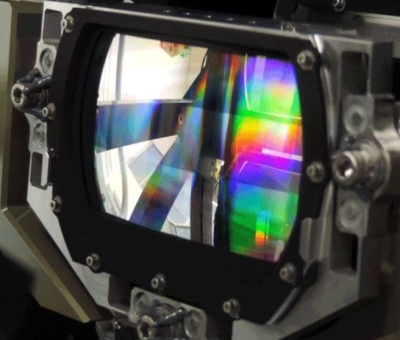
Ozone (O3) is present both in the stratosphere (the upper layer of the atmosphere) and in the troposphere (the lowest layer of the atmosphere where most weather occurs), but it has different impacts in each layer. In the stratosphere, O3 is beneficial, and protects humans, plants, and animals from harmful UV radiation. In the troposphere, however, O3 is a potent greenhouse gas and air pollutant that can aggravate existing health problems in humans, especially those with respiratory illnesses.
O3 forms from chemical reactions between nitrogen oxides and volatile organic compounds (VOCs), emitted primarily from cars with internal combustion engines, power plants, and other industrial facilities. These reactions take place in the presence of sunlight, and unhealthy levels of O3 are most often observed on very sunny days and in urban environments.
Note: An Earthdata Login is required to download data from Earthdata Search for for full Giovanni functionality.
Satellite Data
-
Ozone Monitoring Instrument (OMI)
The OMI instrument aboard NASA's Aura satellite (launched in 2004) measures O3 from Earth’s surface to top-of-atmosphere (known as a total column measurement). OMI also measures sulfur dioxide (SO2), aerosols, and cloud top pressure. Some OMI near real-time (NRT) data are available through NASA's Land, Atmosphere Near real-time Capability for EOS (LANCE).- OMI ozone data from Earthdata Search
- OMI ozone data can be visualized and explored using a NASA web-based tool called Giovanni. Learn more about Giovanni.
-
Ozone Mapping and Profiler Suite (OMPS)
The OMPS instrument aboard the joint NASA/NOAA Suomi National Polar-orbiting Partnership satellite (Suomi NPP; launched in 2011) measures O3 in the stratosphere and in the troposphere. OMPS NRT data are available through LANCE. -
Sentinel-5P TROPOMI
Launched in 2017, the Copernicus Sentinel-5 Precursor (Sentinel-5P) satellite is an ESA mission. TROPOMI is the sole instrument aboard the satellite. Level 2 products include total and tropospheric column O3. -
AIRS instrument
The AIRS instrument aboard NASA’s Aqua satellite measures abundances of trace components in the atmosphere, including CH4. The instrument measures the amount of ozone in the total vertical column profile of the atmosphere (from Earth’s surface to top-of-atmosphere). Data are available daily or monthly.- AIRS O3 data from Earthdata Search
- AIRS ozone data can be visualized and explored using a NASA web-based interactive tool called Giovanni. Learn more about Giovanni in Tools for Data Access and Visualization.
-
TES
Launched in July 2004 aboard the NASA's Aura satellite, TES was the first instrument designed to monitor O3 in the lowest layers of the atmosphere directly from space. Data collection for TES was completed in January 2018. TES data are available in daily and monthly averages. -
MLS instrument
The MLS instrument aboard the NASA's Aura satellite makes measurements of atmospheric composition, temperature, humidity, and cloud ice that are needed to track the stability of the stratospheric ozone layer, help improve predictions of climate change and variability, and help improve understanding of global air quality. MLS O3 data are available as daily, monthly, and NRT products.
Airborne Data
- ATom
ATom is a NASA EVS-2 mission to study the impact of human-produced air pollution on greenhouse gases and on chemically reactive gases in the atmosphere. ATom deployed an extensive gas and aerosol payload on NASA's DC-8 aircraft for systematic, global-scale sampling of the atmosphere, profiling continuously from 0.2 to 12 km altitude. Around-the-world flights were conducted in each of the four seasons between 2016 and 2018. - ACT-America
ACT-America is a NASA EVS-2 mission that studied the transport and fluxes of atmospheric CO2 and CH4. Starting in the summer of 2016, ACT-America conducted five airborne campaigns across three regions in the Eastern United States to study the transport and fluxes of these two gases. The final campaign concluded in the summer of 2019.
Chlorofluorocarbons
Chlorofluorocarbons (CFCs) are greenhouse gases that trap substantially more heat than CO2. Per pound, CFCs can be thousands or tens of thousands times more powerful at trapping heat than carbon dioxide. These gases also deplete the protective ozone layer in the stratosphere. CFCs were first used in the 1930s as refrigerants and propellants for chemical sprays. Two years after the discovery of the Antarctic ozone hole in 1985, nations of the world signed the Montreal Protocol that regulated ozone-depleting compounds and eventually phased out the production of CFCs.
Note: An Earthdata Login is required to download data from Earthdata Search.
Satellite Data
-
HIRDLS
Launched in 2004, HIRDLS is an instrument aboard NASA's Aura satellite. The science goals of HIRDLS are to observe global distribution of temperature and concentrations of O3, H2O, CH4, N2O, NO2, HNO3, N2O5, CFC-11, CFC-12, and ClONO2. After launch, activation of the HIRDLS instrument revealed that the optical path was blocked so that only 20% of the aperture could view Earth's atmosphere. However, even with the blockage, measurements at high vertical resolution could be made at one scan angle. HIRDLS stopped recording observations in March 2008.
Airborne Data
-
ATom
ATom is a NASA EVS-2 mission to study the impact of human-produced air pollution on greenhouse gases and on chemically reactive gases in the atmosphere. ATom deployed an extensive gas and aerosol payload on NASA's DC-8 aircraft for systematic, global-scale sampling of the atmosphere, profiling continuously from 0.2 to 12 km altitude. Around-the-world flights were conducted in each of the four seasons between 2016 and 2018.
Water Vapor
Water vapor (H2O) is the most abundant greenhouse gas in the atmosphere. Heat radiated from Earth's surface is absorbed by H2O molecules in the lower atmosphere. H2O also plays an important role in weather and the hydrologic cycle. Changing temperatures can alter the amount of H2O in the atmosphere. As the atmosphere warms, it can hold more H2O, which then causes more warming, creating a feedback loop.
Note: An Earthdata Login is required to download data from Earthdata Search.
Satellite Data
-
AIRS instrument
Data from the AIRS instrument, aboard NASA’s Aqua satellite, provide 3D measurements of temperature, H2O, trace gases, and surface and cloud properties through the atmospheric column. AIRS data are used by weather prediction centers around the world to improve their forecasts. They also are used to assess the skill of climate models and in applications ranging from volcanic plume detection to drought forecasting. -
MLS instrument
The MLS instrument aboard NASA's Aura satellite makes measurements of atmospheric composition, temperature, humidity, and cloud ice that are needed to track the stability of the stratospheric ozone layer, help improve predictions of climate change and variability, and help improve understanding of global air quality. MLS water vapor data are available as daily, monthly, and near real-time (NRT) products. -
Cross-track Infrared and Microwave Sounding Suite (CrIMSS)
NASA's Sounder Science Investigator-led Processing System (Sounder SIPS) is responsible for processing and reprocessing data products from two instruments aboard the Suomi NPP satellite: the Advanced Technology Microwave Sounder (ATMS) and the Cross-Track Infrared Sounder (CrIS), collectively referred to as CrIMSS. Sounder SIPS global gridded H2O products use the scientific algorithm software from the Suomi NPP Science Team’s Sounder Discipline Group. -
TES
TES is an instrument aboard NASA's Aura satellite, which launched on July 15, 2004. TES provided measurements of O3, H2O, CO, CH4, NO2, and HNO3 for 16 orbits every other day. Data collection for TES was completed in January 2018. TES data are available in daily and monthly averages.
Airborne Data
-
Atmospheric Tomography (ATom) Mission
ATom is a NASA Earth Venture suborbital (EVS-2) mission to study the impact of human-produced air pollution on greenhouse gases and on chemically reactive gases in the atmosphere. ATom deployed an extensive gas and aerosol payload on NASA's DC-8 aircraft for systematic, global-scale sampling of the atmosphere, profiling continuously from 0.2 to 12 km altitude. Around-the-world flights were conducted in each of the four seasons between 2016 and 2018. -
Carbon in Arctic Reservoirs Vulnerability Experiment (CARVE)
CARVE is an EVS-1 mission. From 2011 through 2015, CARVE collected detailed measurements of greenhouse gases in the Alaskan Arctic and developed models to quantify Arctic carbon fluxes and carbon cycle-climate processes. CARVE provides an integrated set of greenhouse gas data that provides experimental insights into Arctic carbon cycling. -
Arctic-Boreal Vulnerability Experiment (ABoVE)
In 2017, NASA's ABoVE used aircraft equipped with the Airborne Visible InfraRed Imaging Spectrometer-Next Generation (AVIRIS-NG) instrument to fly over 11,583 mi2 (30,000 km2) of the Arctic landscape to measure concentrations of CO, CO2, CH4, and H2O.
Model Data
NEX-GDDP-CMIP6
The NASA Earth Exchange Global Daily Downscaled Projections (NEX-GDDP) dataset is comprised of high-resolution, bias-corrected global downscaled climate projections derived from the General Circulation Model (GCM) runs conducted under the Coupled Model Intercomparison Project Phase 6 (CMIP6) and across all four “Tier 1” greenhouse gas emissions scenarios known as Shared Socioeconomic Pathways (SSPs).
This dataset provides a set of global, high resolution, bias-corrected climate change projections that can be used to evaluate climate change impacts on processes that are sensitive to finer-scale climate gradients and the effects of local topography on climate conditions. Uses include: air temperature, precipitation volume, humidity, stellar radiation, and atmospheric wind speed.
NEX-GDDP-CMIP6 data are available through the NASA Center for Climate Simulation (NCCS):
Environmental Impacts
NASA has numerous Earth science datasets that can be used to monitor environmental impacts from greenhouse gases. Land cover and land use change data are frequently used to monitor environmental and human-derived trends, such as urban sprawl, which can lead to increases in pollutants caused by internal combustion engines and factories. Since 1972, the joint NASA/USGS Landsat series of satellites have continuously acquired space-based images of Earth’s land surface. The Enhanced Thematic Mapper + (ETM+) aboard Landsat-7 is an eight-band, multispectral scanning radiometer capable of providing high-resolution imaging information of Earth’s surface. The Operational Land Images (OLI) aboard Landsat-8 acquires data in the visible, near infrared, and short wave infrared portions of the spectrum. The OLI-2 aboard Landsat-9 is a copy of the OLI aboard Landsat 8, and provides visible and near infrared/shortwave infrared (VNIR/SWIR) imagery consistent with previous Landsat spectral, spatial, radiometric, and geometric qualities. The OLI-2 provides a greater bit depth for its imagery as compared to the 12-bit data downlinked from the OLI, which provides additional information for dark targets like dense forests.
Nighttime lights also can be used to monitor changes in human behavior and the resulting impacts from these changes. NASA’s Black Marble is a daily calibrated, corrected, and validated product suite that enables nightlight data to be used for scientific observations. The Black Marble product suite is derived from the Visible Infrared Imaging Radiometer Suite (VIIRS) instrument, which includes a day night band (DNB). DNB is a panchromatic band sensitive to visible and near-infrared wavelengths. Black Marble data enable a wide range of applications related to monitoring greenhouse gases:
- Monitoring changes in energy infrastructure in urban areas
- Tracking wildfires and gas flares
- Short-term weather prediction
- Disaster response communities
The 2020 Environmental Performance Index (EPI), available through NASA’s Socioeconomic Data and Applications Center (SEDAC), ranks 180 countries on 32 performance indicators in policy categories including air quality, sanitation and drinking water, and waste management. The EPI uses a methodology that facilitates cross-country comparisons among economic and regional peer groups.
Socioeconomic
Air quality-related deaths and diseases that are exacerbated by air pollution are preventable, but prevention requires a knowledge of where vulnerable populations exist and what interventions are needed in these communities. Poor air quality tends to be elevated in low to middle-income countries, where 98% of urban centers with populations greater than 100,000 do not meet World Health Organization (WHO) guidelines.
Integrating socioeconomic data with air quality data can provide a more accurate analysis of populations facing greater exposure and vulnerability from pollutants. A number of socioeconomic factors need to be considered when analyzing air quality, including:
- Population
- Poverty
- Unemployment
- Academic attainment
- Housing burden
- Social vulnerability
NASA’s Socioeconomic Data and Applications Center (SEDAC) is the home for socioeconomic data in NASA’s Earth Observing System Data and Information System (EOSDIS) collection. Hosted at Columbia University’s Center for International Earth Science Information Network (CIESIN), SEDAC synthesizes Earth science and socioeconomic data and information in ways useful to a wide range of decision makers and other applied users and serves as an “Information Gateway” between the socioeconomic and Earth science data and information domains.
SEDAC’s Air Quality Data for Health-Related Applications data collection provides air quality data for health-related research and applications. This collection consists of the Daily and Annual PM2.5 Concentrations for the Contiguous United States, 1-km Grids, v1 (2000–2016) and Daily 8-Hour Maximum and Annual O3 Concentrations for the Contiguous United States, 1-km Grids, v1 (2000–2016) datasets. Additional SEDAC datasets on population exposure and vulnerability (Note: An Earthdata Login is required for data access):
- Population Dynamics:
- Socio-Economic Baseline Data, v1 (1980, 1990, 1991, 1992, 1993, 1994, 1995, 2025)
- Poverty-related Data