During and after World War I, American farmers fanned out across the Great Plains to grow wheat. They plowed up the native grasses, exposing fertile topsoil and straining the sensitive grassland ecosystems. Then, in the early 1930s, Dust Bowl storms ravaged the stripped and drought-weakened Plains. Blizzard-force winds billowed tons of loose soil into the air, forming giant dust clouds that buried entire farms and ultimately blew all the way to the east coast of the United States.
Humans have long relied on crops and vegetation for survival. In more recent human history, scientists have uncovered the larger role of vegetation in the health of the complete ecosystem of our planet. But understanding the complex needs of an ecosystem requires a lot of information. Farmers and scientists now rely on ground instruments and satellite data to determine what will keep an ecosystem or a cropland healthy. Different ecosystems require varying amounts of sunlight, water, and carbon dioxide. These requirements are characterized by exchanges, or fluxes, between the ecosystem and the atmosphere. If scientists can investigate the relationship between ecosystem health and the fluxes of carbon dioxide, water, and radiation, they can better understand global vegetation cycles and assess human impact in ecosystems around the world.

Manually collecting flux data from each ecosystem is too time-consuming and expensive, so many scientists rely on FLUXNET data, available from NASA"s Oak Ridge National Laboratory Distributed Active Archive Center (ORNL DAAC). FLUXNET, a global network of more than 400 micrometeorological tower sites, compiles data and information from ground-based flux towers stationed in a variety of ecosystems around the world. Each tower measures the fluxes of solar radiation (sunlight), water vapor, carbon dioxide, and other trace gases between the atmosphere and the ecosystem. The towers also measure additional ecosystem properties, such as precipitation, air and ground temperatures, vegetation biomass, soil respiration, and soil moisture, which are valuable for studying vegetation cycles.
Characterizing and verifying vegetation
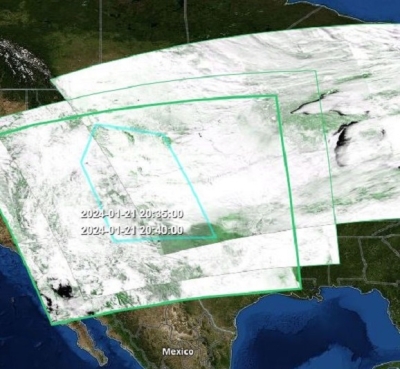
Scientists use the flux data in a variety of ways, including computer models that simulate how weather, climate, and vegetation ecosystems interact. Tim Wilson, a researcher with the National Oceanic and Atmospheric Administration (NOAA), is working with colleagues to create a time series of data that will provide modelers with vegetation characteristics for sites across the United States. Wilson said, “We collected data from eleven flux towers covering grasslands, deciduous forests, evergreen forests, croplands, and desert.” The towers provided a broad cross-section of vegetation types in the United States.
Wilson used data from these eleven towers to calculate the normalized difference vegetation index (NDVI) and Leaf Area Index (LAI), indicators of overall plant health, seasonal growth, and changes in the amount of leaf and vegetation cover in the ecosystem surrounding the tower. “NDVI and LAI data can reveal an ecosystem’s role,” Wilson said. “If you mischaracterize the vegetation, you mischaracterize the distribution of the energy, water, and carbon budgets.”
To confirm his calculations and eliminate faulty data, Wilson needed a second data source. However, he had additional field measurements from only one of the crop sites. So, he and his colleagues compared his NDVI and LAI calculations from flux towers to subsets of data from the Moderate Resolution Imaging Spectroradiometer (MODIS) instrument aboard NASA's Terra and Aqua satellites, also located at ORNL DAAC. He found that the ground-based and satellite-based measurements agreed. “The overall patterns were consistent and reproduced the seasonal trend: growth in spring and summer, and die-off in fall and winter,” Wilson said.
Although there are several remote sensing sources that could have supplied appropriate data, Wilson chose MODIS data because of its ease of use. ORNL DAAC had created special subsets of MODIS data that correlated specifically to the flux tower locations Wilson was studying. “MODIS data provided the best way to tell that our flux tower measurements made sense,” Wilson said.

Revealing a greener Amazon
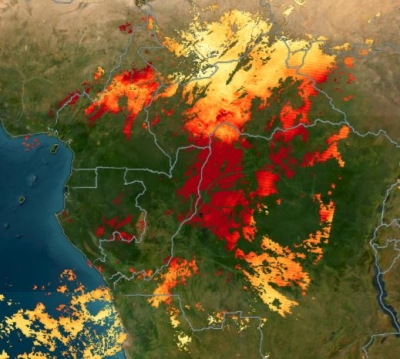
Other scientists are also applying this combination of ground- and space-based data to verify their observations of vegetation cycles around the globe. Alfredo Huete, at the University of Arizona, used a similar combination to study vegetation in the Amazonian rainforest in South America. Huete said, “Rain forests worldwide play a large role in global energy budgets because of their ability to store carbon dioxide, a greenhouse gas.” Like the erosive farm practices on the Great Plains during the early 1900s, human land-use activities, such as clear-cutting and burning of forests, are shrinking the size of many of the world’s rain forests and affecting their ability to store carbon. More accurately characterizing rain forest vegetation may help climate modelers understand how much carbon the forests are absorbing, and allow them to better investigate the forest’s roles in mitigating climate change.
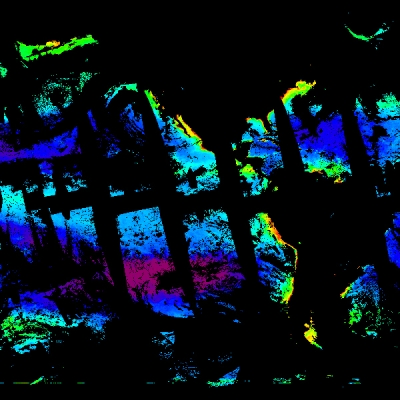
First, however, Huete and his colleagues needed to solve a problem. Traditional remotely sensed NDVI measurements can reach a point of saturation, beyond which they underestimate the vegetation cover, particularly in densely forested areas like the Amazon. To overcome this limitation, Huete calculated an Enhanced Vegetation Index (EVI) from MODIS land-cover data, which is available from NASA's Land Processes DAAC (LP DAAC). The EVI calculations corrected the saturation problem and provided the full canopy conditions in the Amazon.
Instead of going dormant during the dry season, Huete discovered that vegetation in the Amazon responded to the increased amount of sunlight and became 25 percent more green and productive. His finding defied the long-held belief that the Amazon rain forests either decrease in productivity during the dry season, or remain the same year-round. Traditional NDVI and LAI measurements were not sensitive enough to see seasonal changes in the Amazon rain forest canopy, causing scientists to mischaracterize the vegetation cycle for the entire region. Huete said, “Dozens of papers were based on rain forest cycles being flat, with no seasonality, or assumed that rain forest vegetation would green up primarily in response to rainfall.” Huete’s finding meant that rain forests were very seasonal and that sunlight during the dry season was the main driver.
To verify their findings, the researchers used data from flux towers stationed throughout the Amazon. “The flux towers may be the only in situ data source that has continuous time series,” Huete said. “We were seeing a pattern that was not seen before in the NDVI data. No one would have accepted the satellite data results if it were not for the independent flux tower data,” Huete said. Comparing the two data sources provided confidence that the MODIS EVI data successfully recorded more accurate vegetation conditions.
Future focus
Huete’s findings may help scientists better understand the carbon budgets of tropical forests. He is also curious about other rain forests, particularly in Southeast Asia where human activity has had a much larger impact. He is planning to use MODIS EVI calculations to observe how the resulting vegetation is regenerating, and if it is beginning to respond to sunlight during the dry season. “With EVI, we have this enhanced sensitivity, so now we’re looking to see what we missed before,” Huete said. Understanding the energy cycles of new-growth forests will help scientists understand how much atmospheric carbon new growth is absorbing. Wilson plans to continue studying the eleven selected sites in the United States and comparing them to MODIS data to fully characterize the vegetation at each site. Wilson said, “Our goal is to provide people with additional information about our sites when we give them our flux tower data.” By giving users more detailed information about the vegetation conditions present when tower measurements were made, Wilson’s study provides data that may improve the accuracy of climate vegetation models.
MODIS data, combined with flux tower data, are giving scientists and modelers instant access to information about Earth’s various ecosystems, whether they are rain forests half a world away or croplands next door. And this developing time series of flux records will help scientists understand ecosystem health and provide insight into how Earth’s vegetation is faring. “People use these data in climate models so they can see what the vegetation is doing now and understand what the vegetation might do under future conditions,” Wilson said. “That’s why this information is critical.”
References
Huete, A. R., K. Didan, Y. E. Shimabakuro, P. Ratana, S. R. Saleska, L. R. Hutyra, W. Yang, R. R. Nemani, and R. Myneni. 2006. Amazon rainforest green-up with sunlight in dry season. Geophysical Research Letters 33, L06405, doi:10.1029/2005GL025583.
Wilson, T. B., and T. P. Meyers. 2007. Determining vegetation indices from solar and photosynthetically active radiation fluxes. Agricultural and Forest Meteorology 144(3–4): 160–179.
For more information
NASA Land Processes Distributed Active Archive Center (LP DAAC)
NASA Oak Ridge National Laboratory (ORNL DAAC)
Moderate Resolution Imaging Spectroradiometer (MODIS)
| About the data | |||
|---|---|---|---|
| Satellites | Terra and Aqua | Terra and Aqua | |
| Sensors | Moderate Resolution Imaging Spectroradiometer (MODIS) |
Flux towers, Radiometer |
MODIS |
| Data sets | MODIS ASCII Subsets | LAI NDVI |
MODIS Land Products |
| Resolution | 7 by 7 kilometers | 1,200 by 1,200 kilometers | |
| Parameters | Vegetation Indices Leaf Area Index (LAI) Normalized Difference Vegetation Index (NDVI) |
Vegetation indices LAI NDVI |
Vegetation indices LAI Enhanced Vegetation Index (EVI) |
| DAACs | NASA Oak Ridge National Laboratory Distributed Active Archive Center (ORNL DAAC) | NASA ORNL DAAC | NASA Land Processes DAAC (LP DAAC) |