On a relatively cool day, Michel Verstraete and Bob Scholes swish through knee-deep wild grass. They stop, position a laser scanner on its tripod legs, and wait a moment as its red eye records the beautiful geometry of South African trees, the bonsai shape of the knobthorn, or the clumped, erratic canopy of the red bushwillow.
They are sampling these intricate features to create a ground reference for the savanna environment, a map of sorts for how the sun’s rays glint off tree and shrub leaves every which way, bounce off the ground, and shoot skyward into the atmosphere. When combined with a view from a satellite flying above, a more complete picture of this fragile ecosystem will emerge and help them monitor how the landscape is changing. And having that complete picture is crucial for studying all ecosystems, not just savannas in Africa.
The problem is, no satellite instrument has mapped the myriad structural features of the land surface both closely enough and frequently enough to monitor change on a small scale. Or at least none had until now. Seeing things a little differently helped these researchers uncover a hidden perspective, a multi-dimensional view of the Earth’s surface that once looked flat.

The nature of reflectance
Scientists like Verstraete and Scholes have been studying the reflectance of the Earth’s surface a long time now. The first Earth Observation satellites were launched in the mid-1970s. Advanced at the time, these space behemoths could see in just two or three channels of the spectrum and were primitively calibrated by today’s standards, like an outdated eyeglass prescription. To sort out the reflectance measurements and deal with other constraints, like large volumes of data, scientists devised simple ratios and formulas by combining the channels in different ways to end up with a single value for each pixel. Basic patterns of the landscape emerged. One such formula is the Normalized Difference Vegetation Index (NDVI), which highlights where vegetation occurs. Pixel by pixel, scientists have long used NDVI to reveal vegetation patterns and have mapped most of Earth’s surface this way.
Yet, as satellite sensing has advanced, it is now possible to get more meaningful measurements. Michel Verstraete, an atmospheric physicist with the Joint Research Centre’s Institute for Environment and Sustainability in Ispra, Italy, said, “Now that we have better instruments with many more channels, there is no reason to continue to use those old vegetation indices.” Biodiversity expert and ecologist with South Africa’s Council for Scientific and Industrial Research, Bob Scholes, agrees. But much of the science community studying vegetation continues to rely on NDVI, in part due to its simplicity. Speaking at a recent forests conference, Scholes said, “I’m very fond of that quote by Einstein, ‘Everything should be as simple as possible,’ and he goes on to warn, ‘but no simpler.’”
The fact is, scientists know that sorting out how solar radiation interacts—with the atmosphere, the surface, and the instrument, to name but a few factors—is no trivial matter. First, consider bidirectional reflectance, named for the interplay between two main factors: the direction of illumination and the direction of the viewer. Put another way, if the direction of the sun or your position changes, the object you are observing will look very different. Now add in a wide variety of surfaces, from the mirror-like surface of a calm lake to the spiky texture of a pine forest, and the equation gets complicated rather quickly.
Next, consider how the instrument sees. Most satellite instruments look straight down, or nadir. “At least that is what people believe,” Verstraete said. But since this downward view from space on a swath of land is typically on the order of hundreds or even thousands of kilometers across, it is like looking through a very large wide-angle lens. The outer edges of the shot fan out and only the middle is nadir. Verstraete explained, “That means you are actually looking at quite a range of different angles. The environment could be absolutely homogenous, and even if it is illuminated the same way, you will still have quite a lot of variation just because you are looking at it from different directions. So the problem is that, for many years, people have rarely taken that into account.”

From every angle
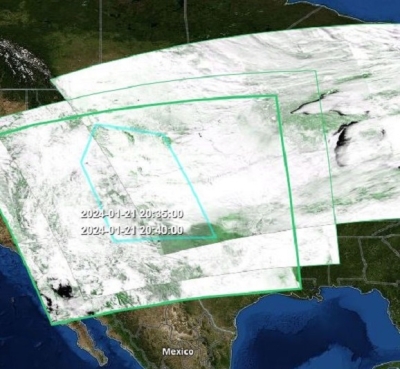
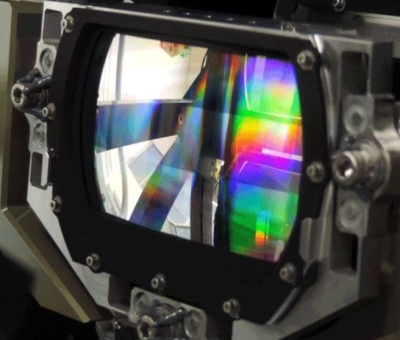
Yet how might an instrument better capture this complicated reality? The answer seemed to lie with the Multi-angle Imaging SpectroRadiometer (MISR) on the NASA Terra satellite. “For all these years, most instruments flying until MISR were observing the environment from only one vantage point,” Verstraete said. MISR has not one, but nine cameras: four in front, one at nadir, and four in back. What is more, each camera quickly views the same spot in four channels, for a total of thirty-six channels. “So now you can start documenting how the reflectance changes with the angles because you have those nine views in only a few minutes, and the environment doesn’t have time to change in between,” Verstraete said. MISR could provide those multiple views, but there was a major hurdle.
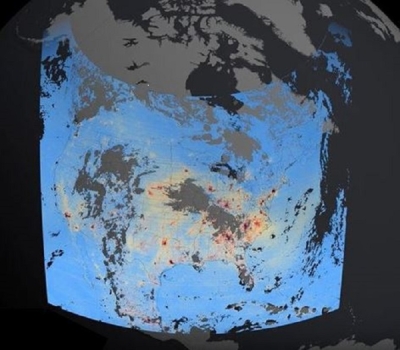
To truly capture changes happening in living systems, like the savanna environment Scholes specializes in, they would need to zoom closer. “Biodiversity is extremely variable in space,” Verstraete said. “Sometimes there’s a species that’s only available on one hectare.” Unfortunately, the smallest area of ground view from MISR was 1.21 square kilometers, a view of more than a hundred hectares (299 acres).
So Verstraete enlisted the help of colleague and computer scientist, Linda Hunt. At the time, Hunt worked at NASA's Atmospheric Science Data Center (ASDC) in Langley, Virginia, where the MISR data are housed. Original MISR data were actually captured at a finer 275 meters (902 feet), but had been downgraded aboard the satellite so that ground stations receiving the data could process a manageable number of bytes. They wondered if there was a way to reliably restore those original data. It would be tough, if not impossible, and there was little funding for this work. In her spare time, Hunt chipped away at the monumental task of writing new software that would untangle the many steps the satellite had taken to process the data to a lower resolution. Care was taken to also add in other enhancements, like sharpening algorithms, which Verstraete and colleagues had refined over the years. By the time she had finished, she had written and implemented an entirely new processing system. The team finally had the close, detailed view they needed, and from a satellite that flew over the same ground roughly once a week.
In the process, they also ended up with a more accurate and easier-to-use product. Scholes explained, “What’s important about this product is it moves us away from space images simply as pictures, towards images as information in a form which is exactly as people on the ground need it. So I don’t have to construct rather dodgy correlations between what the image says and what I measure on the ground.” This was a breakthrough with implications for all kinds of uses, from water management to drought monitoring to agriculture and beyond.
Future angles

To test this, the team unveiled their results at an intensive, hands-on workshop in Cape Town, Africa in October 2011. Twenty-two researchers from eleven African countries and many different focus areas were carefully selected to be the first to work with the new, high-resolution MISR data. Scientists from a variety of agencies also contributed, including the European Space Agency and the newly formed South African National Space Agency (SANSA).
This sharing cultivated a strong partnership. With the full support of NASA, Verstraete gave SANSA the opportunity to be the first institution worldwide to run the new system and generate the new MISR data locally. SANSA has since made it a flagship program of their Earth Observation division and, with the initial help from Hunt, is adopting the processing of all MISR orbits over Africa. Soon they will be able to offer the new high-resolution MISR data not only to scientists, but to forestry managers, policy makers, and others who could benefit from the data. And that, according to SANSA chief Sandile Malinga, is of utmost priority. “One pressing issue for Africa as a whole, for instance, is food security, so monitoring drought is very, very important,” he said.
Meanwhile, scientists like Scholes and Verstraete are also eager to mine this new-found data cache for insight on nagging problems, like desertification. When drought and other conditions converge, like soil erosion, they set off a domino effect that transforms fertile land into desert. Rich, life-giving topsoil that supports crops takes centuries to build up, but just a few seasons to be blown or washed away. Famine then ensues. It is a problem that has plagued the African continent for decades and is difficult to reverse.
Scholes and Verstraete are optimistic about how the new measurements can help. Like the ability to detect cancer cells in a patient, pinpointing where the process begins is critical to limiting its spread. Scholes said, “We wish to get repeatable, reliable measures of ecologically important features of the land surface. That would help us answer questions such as ‘where is desertification occurring?’” With that, Scholes added, “The results allow us to track the state of the land surface in ways which are directly important to people.”
Reference
Verstraete M. M., L. A. Hunt, R. J. Scholes, M. Clerici, B. Pinty, and D. L. Nelson. 2012. Generating 275-m resolution land surface products from the Multi-Angle Imaging Spectroradiometer data. IEEE Transactions on Geoscience and Remote Sensing (99): 1–11, doi:10.1109/TGRS.2012.2189575.
For more information
NASA Atmospheric Science Data Center (ASDC)
Multi-Angle Imaging Spectroradiometer (MISR)
South African National Space Agency (SANSA)
| About the remote sensing data used | |
| Satellite | Terra |
| Sensor | Multi-Angle Imaging Spectroradiometer (MISR) |
| Data sets | MISR Level 1B2 Terrain Top of Atmosphere (TOA) |
| Resolution | 275 meter |
| Parameter | Spectral and directional reflectance |
| DAAC | NASA Atmospheric Science Data Center (ASDC) |
The photograph in the title graphic shows scientists Bob Scholes (left) and Michel Verstraete (right) collecting data from a monitoring station in a subtropical evergreen succulent thicket in Eastern Cape province, South Africa. This highly endangered but species-rich ecosystem is being restored after decades of degradation. New, high-resolution MISR data will help estimate how this restoration affects the global climate.(Courtesy R. Scholes/Council for Scientific and Industrial Research [CSIR], South Africa)